Duration
3 months


[02]The pressure
Risk lived across spreadsheets, legacy dashboards, and disconnected tables. The work was not reading a chart — it was assembling enough context to trust the next move.
Empty shelves = lost sales
Outages cascaded across DCs before anyone owned the SKU exception.
Capital tied up + operational waste
Buffer inventory rose because planners couldn’t see true weeks of supply.
Supply chain disruptions
Late insight turned local misses into multi-DC recovery work — the cost lived outside any one report.
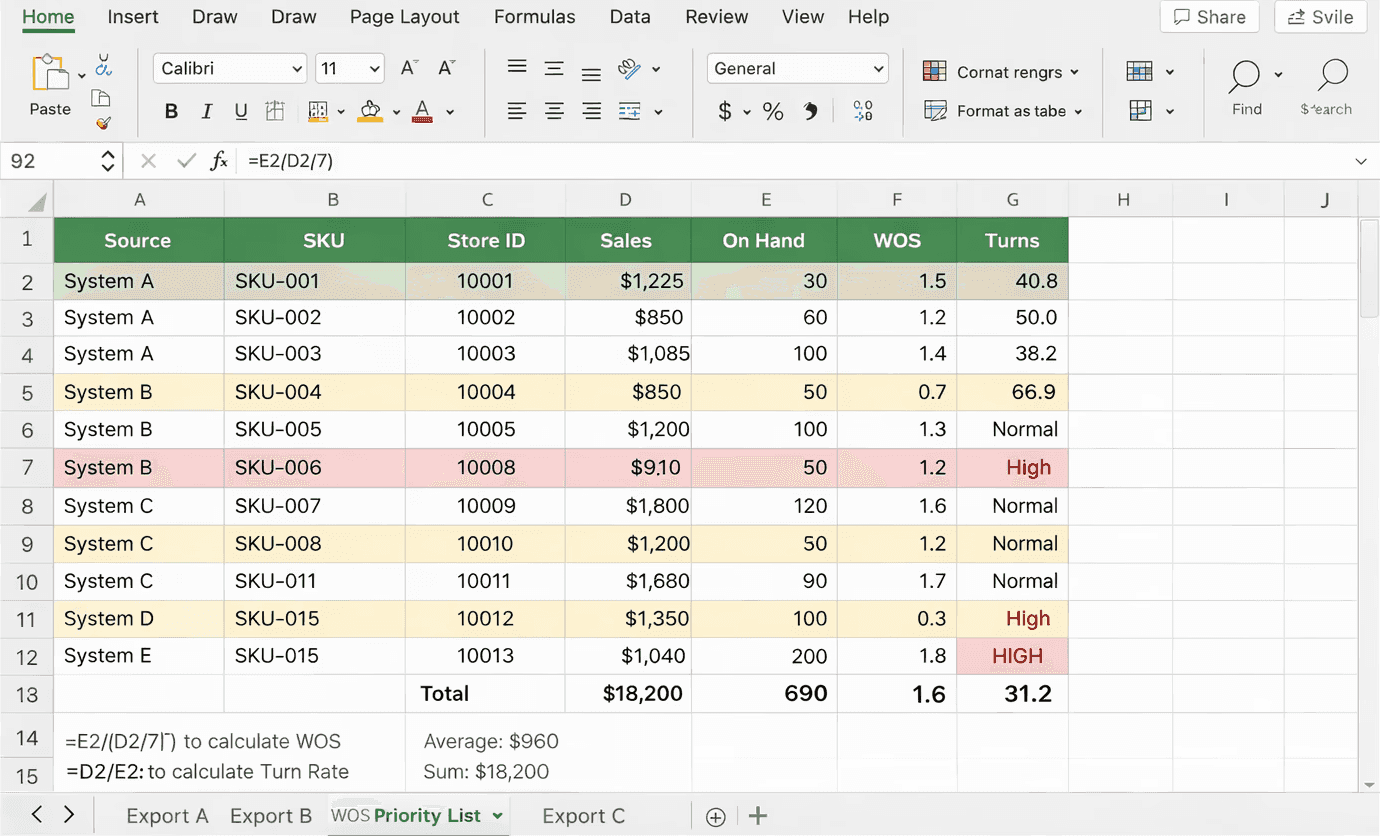


I spend 4 hours a day just trying to find which SKUs need attention. By the time I figure it out, it's often too late. I need the system to tell me what matters and why it matters—not show me 10,000 rows of data.
Pain points
Average daily time hunting critical SKUs across 3 systems.
6 Sources
45% Adoption
24+ Hours lag
[03]Who needed what decision
The real job: finding the right problems to solve first.
Four calendar moments from Monday triage to the actions that stick overnight — framed in Inventory Efficiency report language.
[04]Success criteria
Speed, confidence, and daily adoption — the bar that had to beat spreadsheet ritual.
Reduce the time it takes to identify a critical stock risk from hours to minutes.
Time-to-Detect
Enable planners to trust system insights without needing to manually validate raw data.
Trust
Make the tool the planner's primary workspace, replacing the daily spreadsheet ritual.
Daily Active
[05]Core problem
3 separate legacy systems + Excel reports requiring manual data reconciliation. Planners opened multiple tools just to answer one question: which SKUs need attention today?
Issues surfaced days after they became critical. By the time a stockout appeared in reports, it had already cost the business thousands in lost sales.
No explanation for why a SKU was flagged. Planners didn't trust automated alerts because the system never showed its reasoning — it was a black box.
Thousands of rows with no prioritization logic. Everything looked equally urgent, so nothing felt urgent — more time finding problems than solving them.
[06]Understand the system
Before designing interfaces, we mapped the entire supply-chain ecosystem — people, feeds, and handoffs that decide what gets fixed first.
What I did
Mapped planners, buyers, DC ops, and leadership to see who owned each decision handoff.
4 User GroupsTraced WOS, forecast, transfers, and assortment feeds that fragmented every investigation.
6 Data SourcesSat with planners through morning triage — spreadsheet ritual, tools, and exception loops.
40+ HoursReviewed audit trails to find where context dropped between heatmap, queue, and transfer.
Audit LogsReport architecture

Core decisions
Open on SKUs at High/Medium risk — the full catalog waits one intentional drill away.
Surface highest revenue-impact and exposure items first so triage beats alphabetical hunting.
Explainable Red / Amber / Green classification keeps severity readable without a rebuild.
Scan → understand → act stays one path — context (SKU · DC · period) never drops between views.
[07]Concept exploration
Three catalogue-led concepts failed for investigation depth, guardrails, or cognitive load — convergence locked the exception-first path.


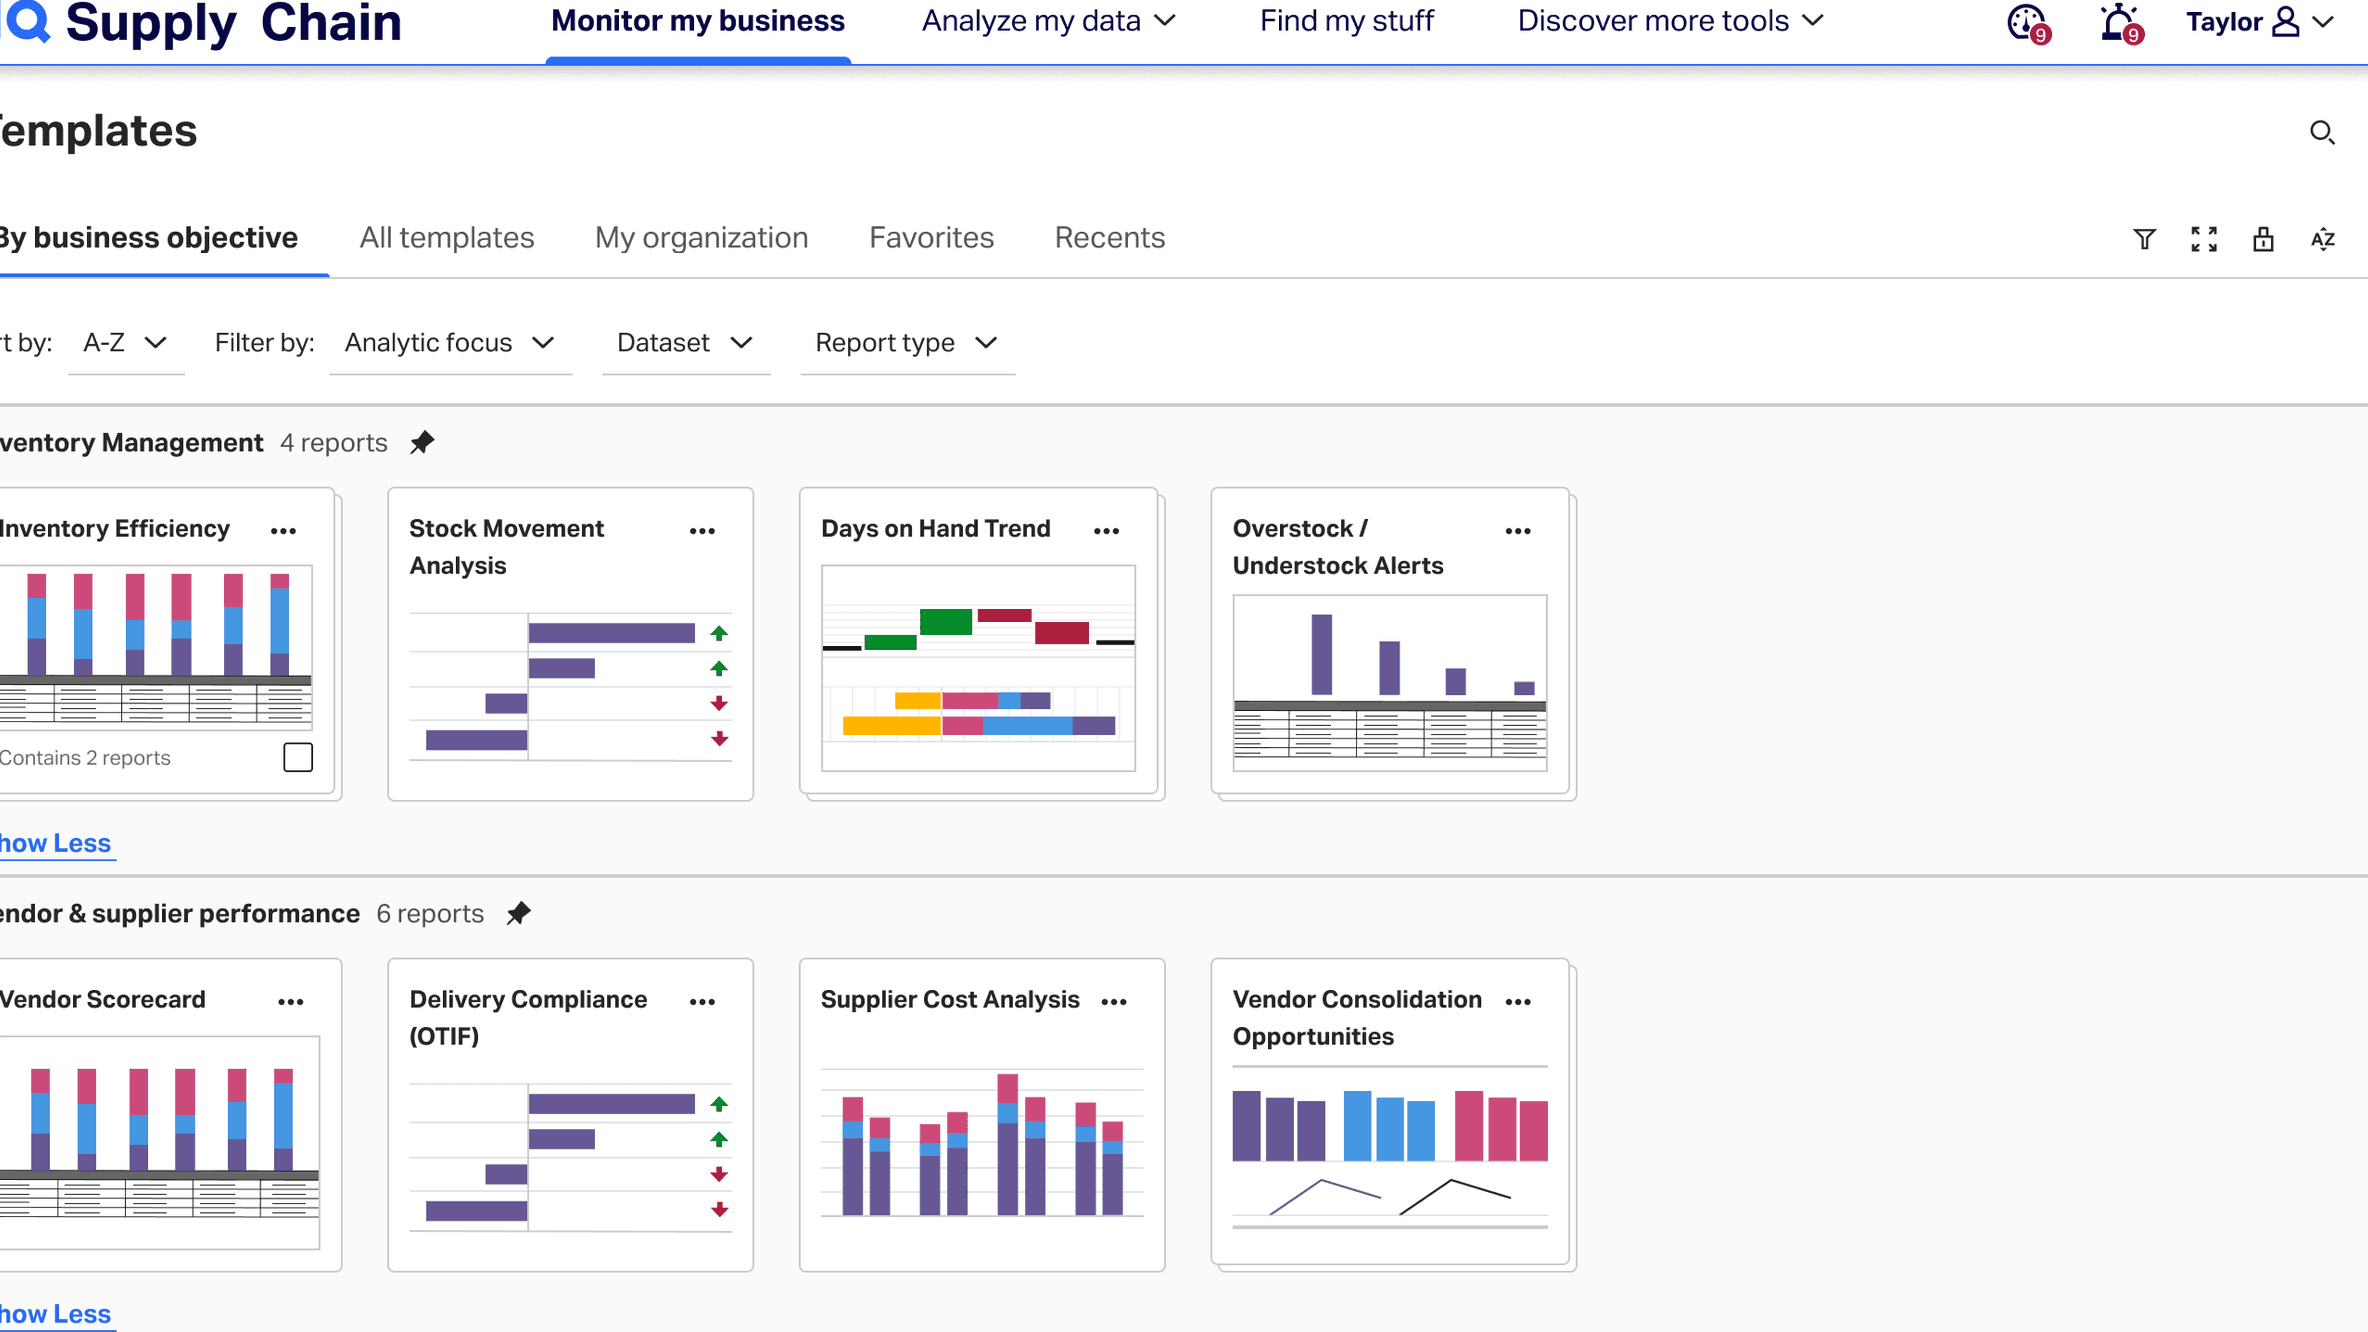
From the reports catalogue into a chart-and-table report — fast scan from a familiar export mental model.
Concept 01 of 03: Catalogue → table & chart report
[08]Convergence
One drill path replaces hunting across disconnected reports.

Layer 01
See concentration of High/Medium risk across store–DC cells before opening any row.
Layer 02
Top SKUs ranked by exposure — triage list replaces spreadsheet hunting.
Layer 03
Full inventory evidence waits one drill down — available when validating, not when scanning.
[09]Define the workflow truth
Current-state sprawl collapses into an exception-first path — triage, localize, validate, act — without leaving the platform.
One exception-first path · Triage → Localize → Root cause → Validate → Act · context preserved end-to-end
Workflow friction → guided path. These are section proof points — not hero impact metrics.
Fragmented before
Reports · systems — context rebuilt on every hop
No saved state
Decision happened outside the platform
Exception-first
See risk before the table — drill instead of hunt
Closed loop, same session
Root cause → validate → act in one workflow
[10]Core Framework
Rank exceptions by likelihood and business exposure so planners start on the risks most worth their time.
Show the drivers behind every flag — velocity, DC concentration, forecast drift — without a raw-data rebuild.
Progressive disclosure lets roles scan, investigate, and act without losing product, DC, or period context.
Intelligence layer
Exception-first heatmap
The workflow begins with an exception-first heatmap that surfaces inventory anomalies across distribution centers and time periods. Planners identify unusual patterns, inspect cells, and move into deeper investigation — shifting from manual data hunting to rapid anomaly detection.
Screen 01 of 03: See risk instantly
[11]Validation
Prototype task: identify and fix three risks. Findings drove label, filter, and approval revisions before pilot.
Sessions
5 moderated
Prototype
Figma hi-fi
Task
Identify & Fix 3 Risks
Task success
100%
Time on task
−60%
Evidence
4/5 planners stalled on “EOP” and “velocity anomaly” before scanning the risk queue.
Change made
Renamed labels to plain language + inline glossary tooltips on first hover.
Evidence
3/5 scrolled the full inventory table without applying Region or Category filters.
Change made
Pinned filter bar above the heatmap and added empty-state guidance when no lens is set.
Evidence
Users hesitated on transfer approve — “what if I’m wrong?” blocked completion.
Change made
Added impact preview + confidence state before confirm; soft default to Review.
[12]Impact
The pilot launched in Q4 and changed how the inventory team ran their week.
I used to dread Monday mornings. Now I can clear my risk queue before my first coffee. It's not just faster; it's less stressful.
 Sarah R. — Sr. Inventory Planner
48 hrs< 1 hr
$3.5M proj$1.4M
4–5 tools1 tool
2.1 / 54.8 / 5
[13]Next step
Inventory, supply, or exception systems — a focused sprint for an investigation spine, explainable risk, and proof stakeholders can trust.


