Duration
1 month
[02]The pressure
Teams could see that a number moved. They could not reliably walk from that signal to the hierarchy, exception, and operational cause in one path.
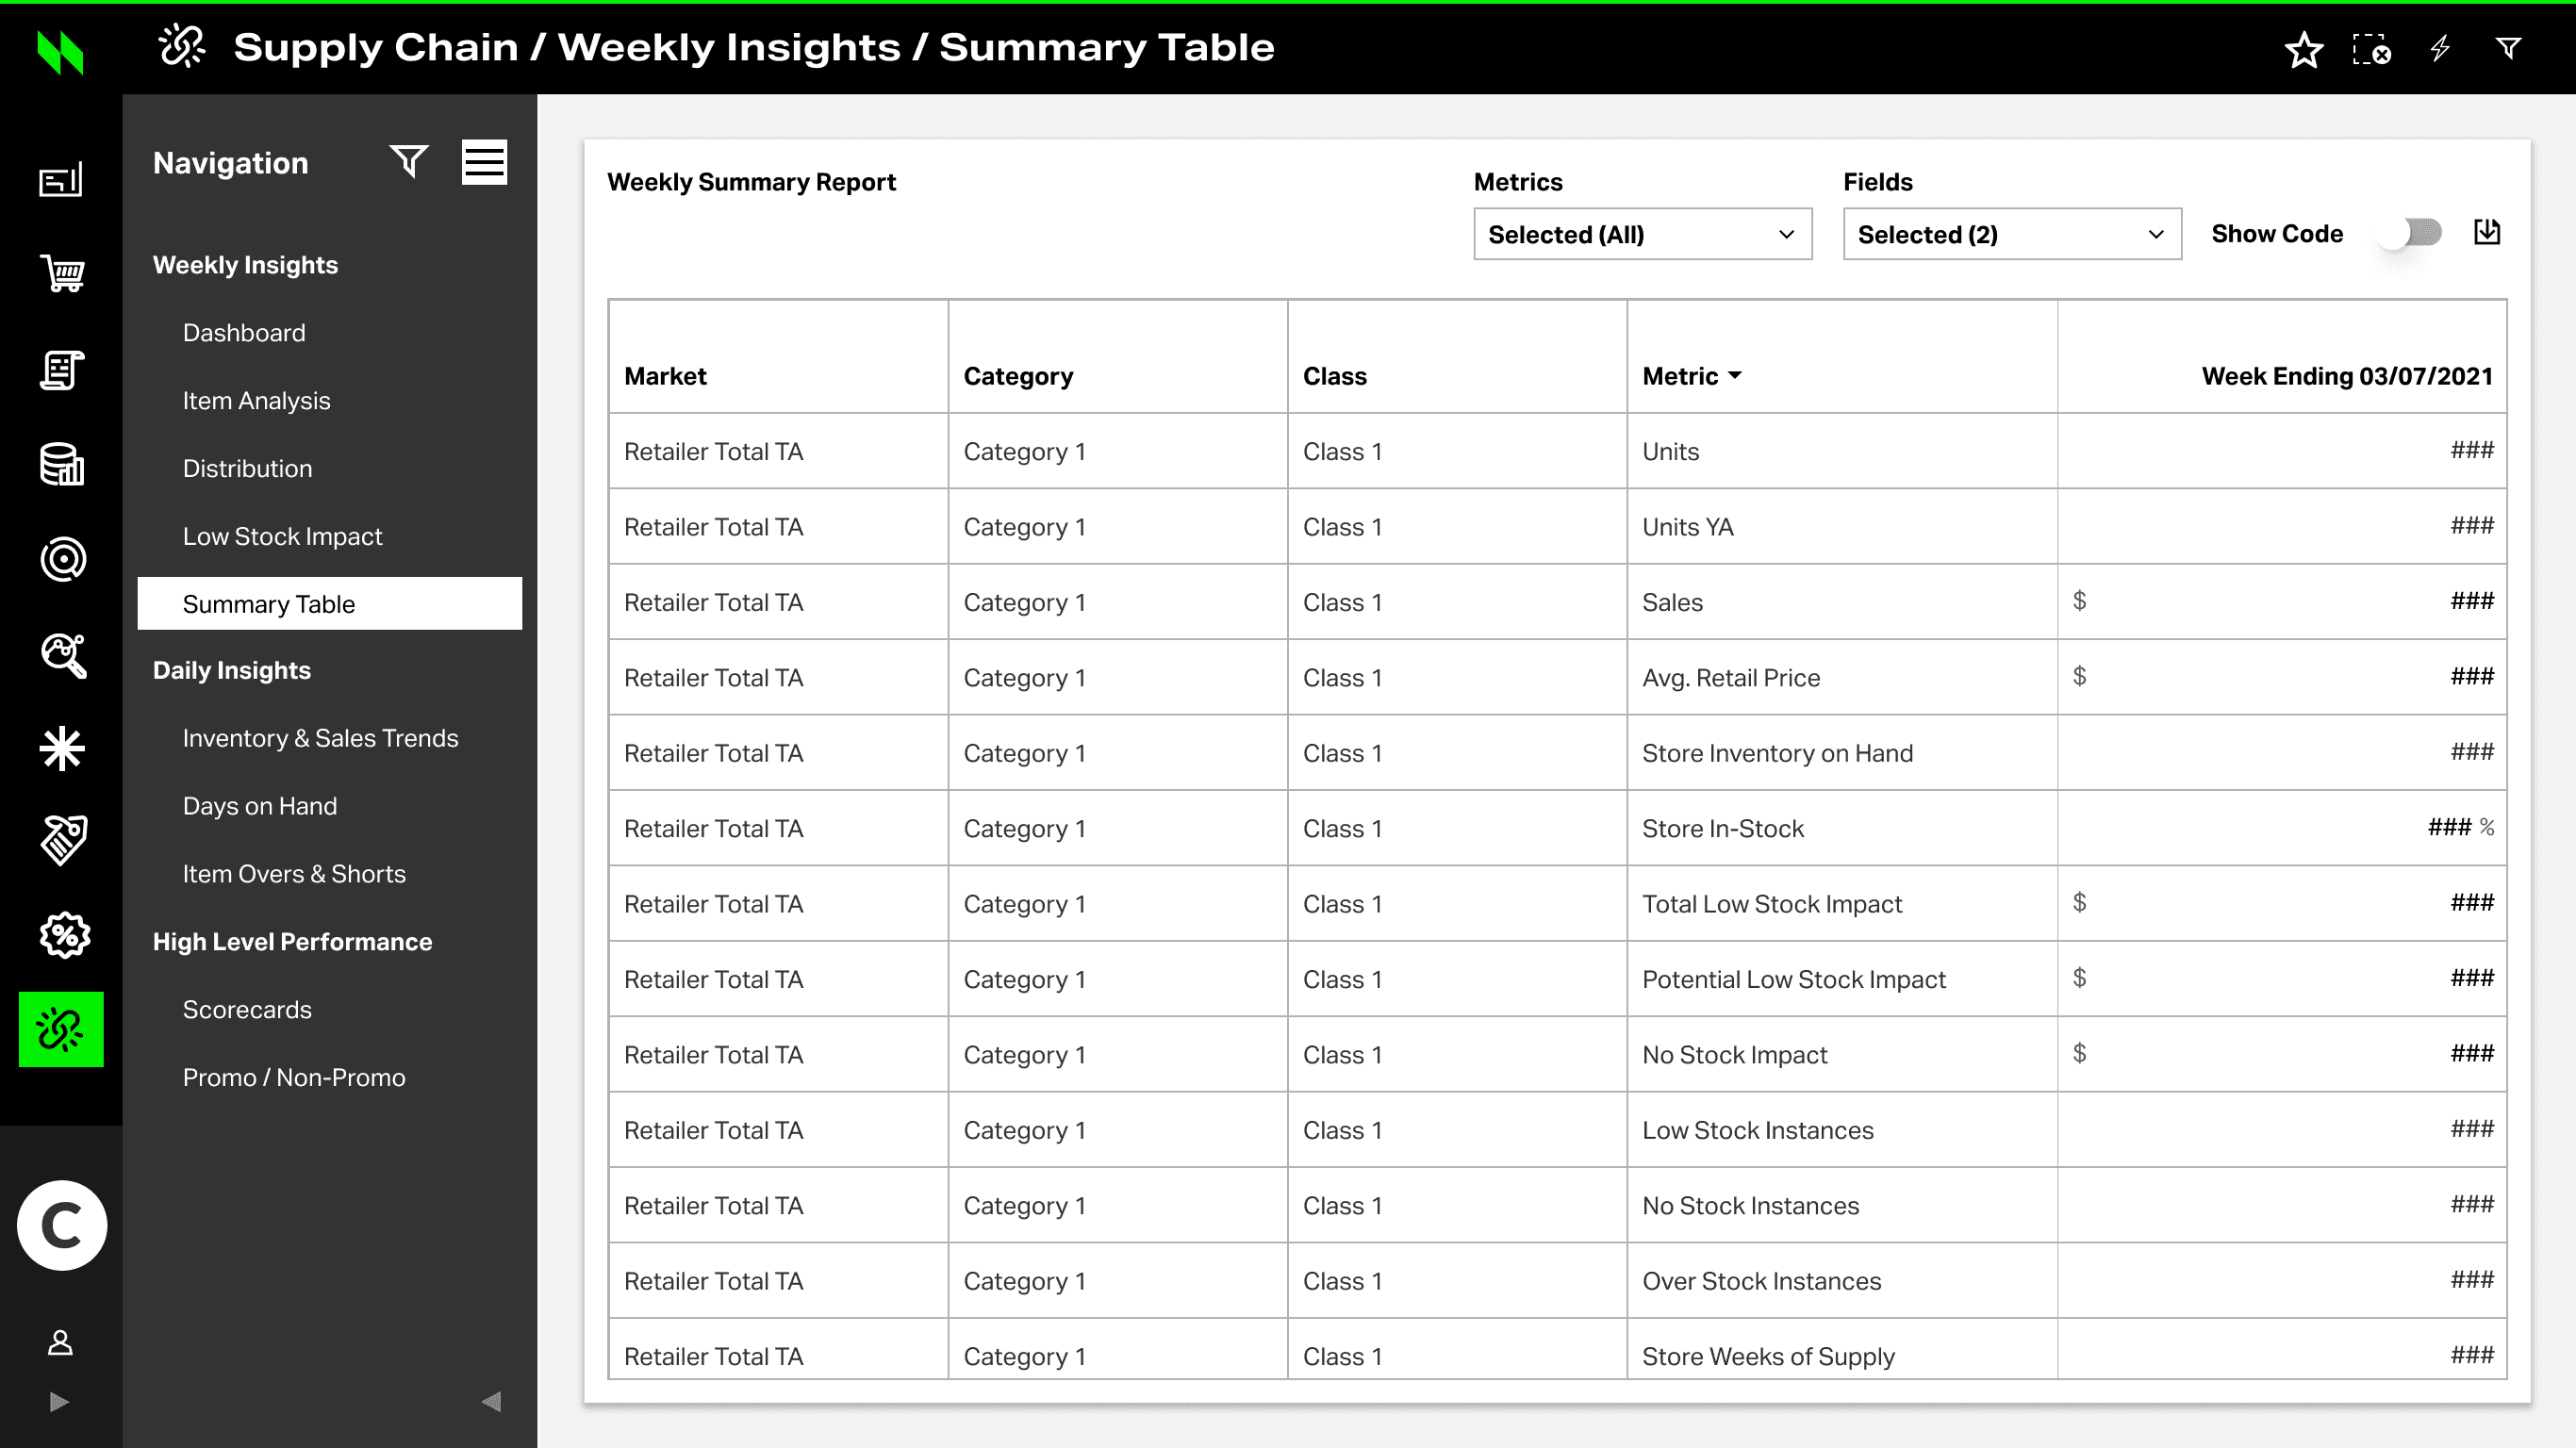
Inventory and sales lived across separate reports, so out-of-stocks and store impact required manual stitching before anyone trusted a diagnosis.
Signal riskProduct, store, business, and distribution breakdowns were hard to keep in context while drilling — slowing QBR prep and exception review.
Investigation costWithout one trustworthy workflow, teams spent hours reconciling before they could decide what to fix first.
Decision lag
[03]Who needed what decision
Analysts needed continuity, managers needed defensible evidence, and reviewers needed to know when a precise-looking number deserved caution.
Move from a KPI to the relevant hierarchy without rebuilding filters or losing the time period.
Default to exceptions first, then preserve the full inventory path for deeper review.
See the driver, its operational consequence, and a snapshot that can support a decision.
Add alert history, affected locations, and an exportable review snapshot.
Delayed or partial store feeds changed how teams should interpret Days on Hand and velocity.
Put confidence states and calculation context directly beside key metrics.
[04]Success criteria
The requirements were not treated as a feature list. They became a traceable contract between the business question, the interaction, and the evidence the interface needed to preserve.
| Business question | UX response |
|---|---|
| Where are we underperforming? | Surface KPI summary row first |
| What is the inventory impact? | Unified sales + inventory view |
| Which child segments are driving it? | Coordinated bottom-table breakdown |
| Is it product, store, or DC level? | Flexible hierarchy selection model |
| What should teams investigate next? | Continuation path to trend / export |
Where did performance change?
Outcome
Carry filters, scope, and time period through every drill.
Outcome
Show freshness and calculation context beside the number.
Outcome
Prepare evidence for the next conversation.
Outcome
[05]Design constraints
The challenge was not a lack of data. It was making the investigation easier while preserving the depth enterprise teams still needed.
[06]Intervention
Design Principles Map — exception-first, continuous context, comparative clarity, and review-ready evidence — with interface behavior proof beside each principle.
Surface stockout risk, overstock, and velocity anomalies before the full inventory table.
Interface behaviorExceptions panel prioritizes issues by impact score and confidence.
Top exceptions
| Issue | Impact | Status |
|---|---|---|
| Stockout risk | 98 | Investigate |
| Overstock | 86 | Review |
| Velocity drop | 72 | Monitor |
See all (128) →
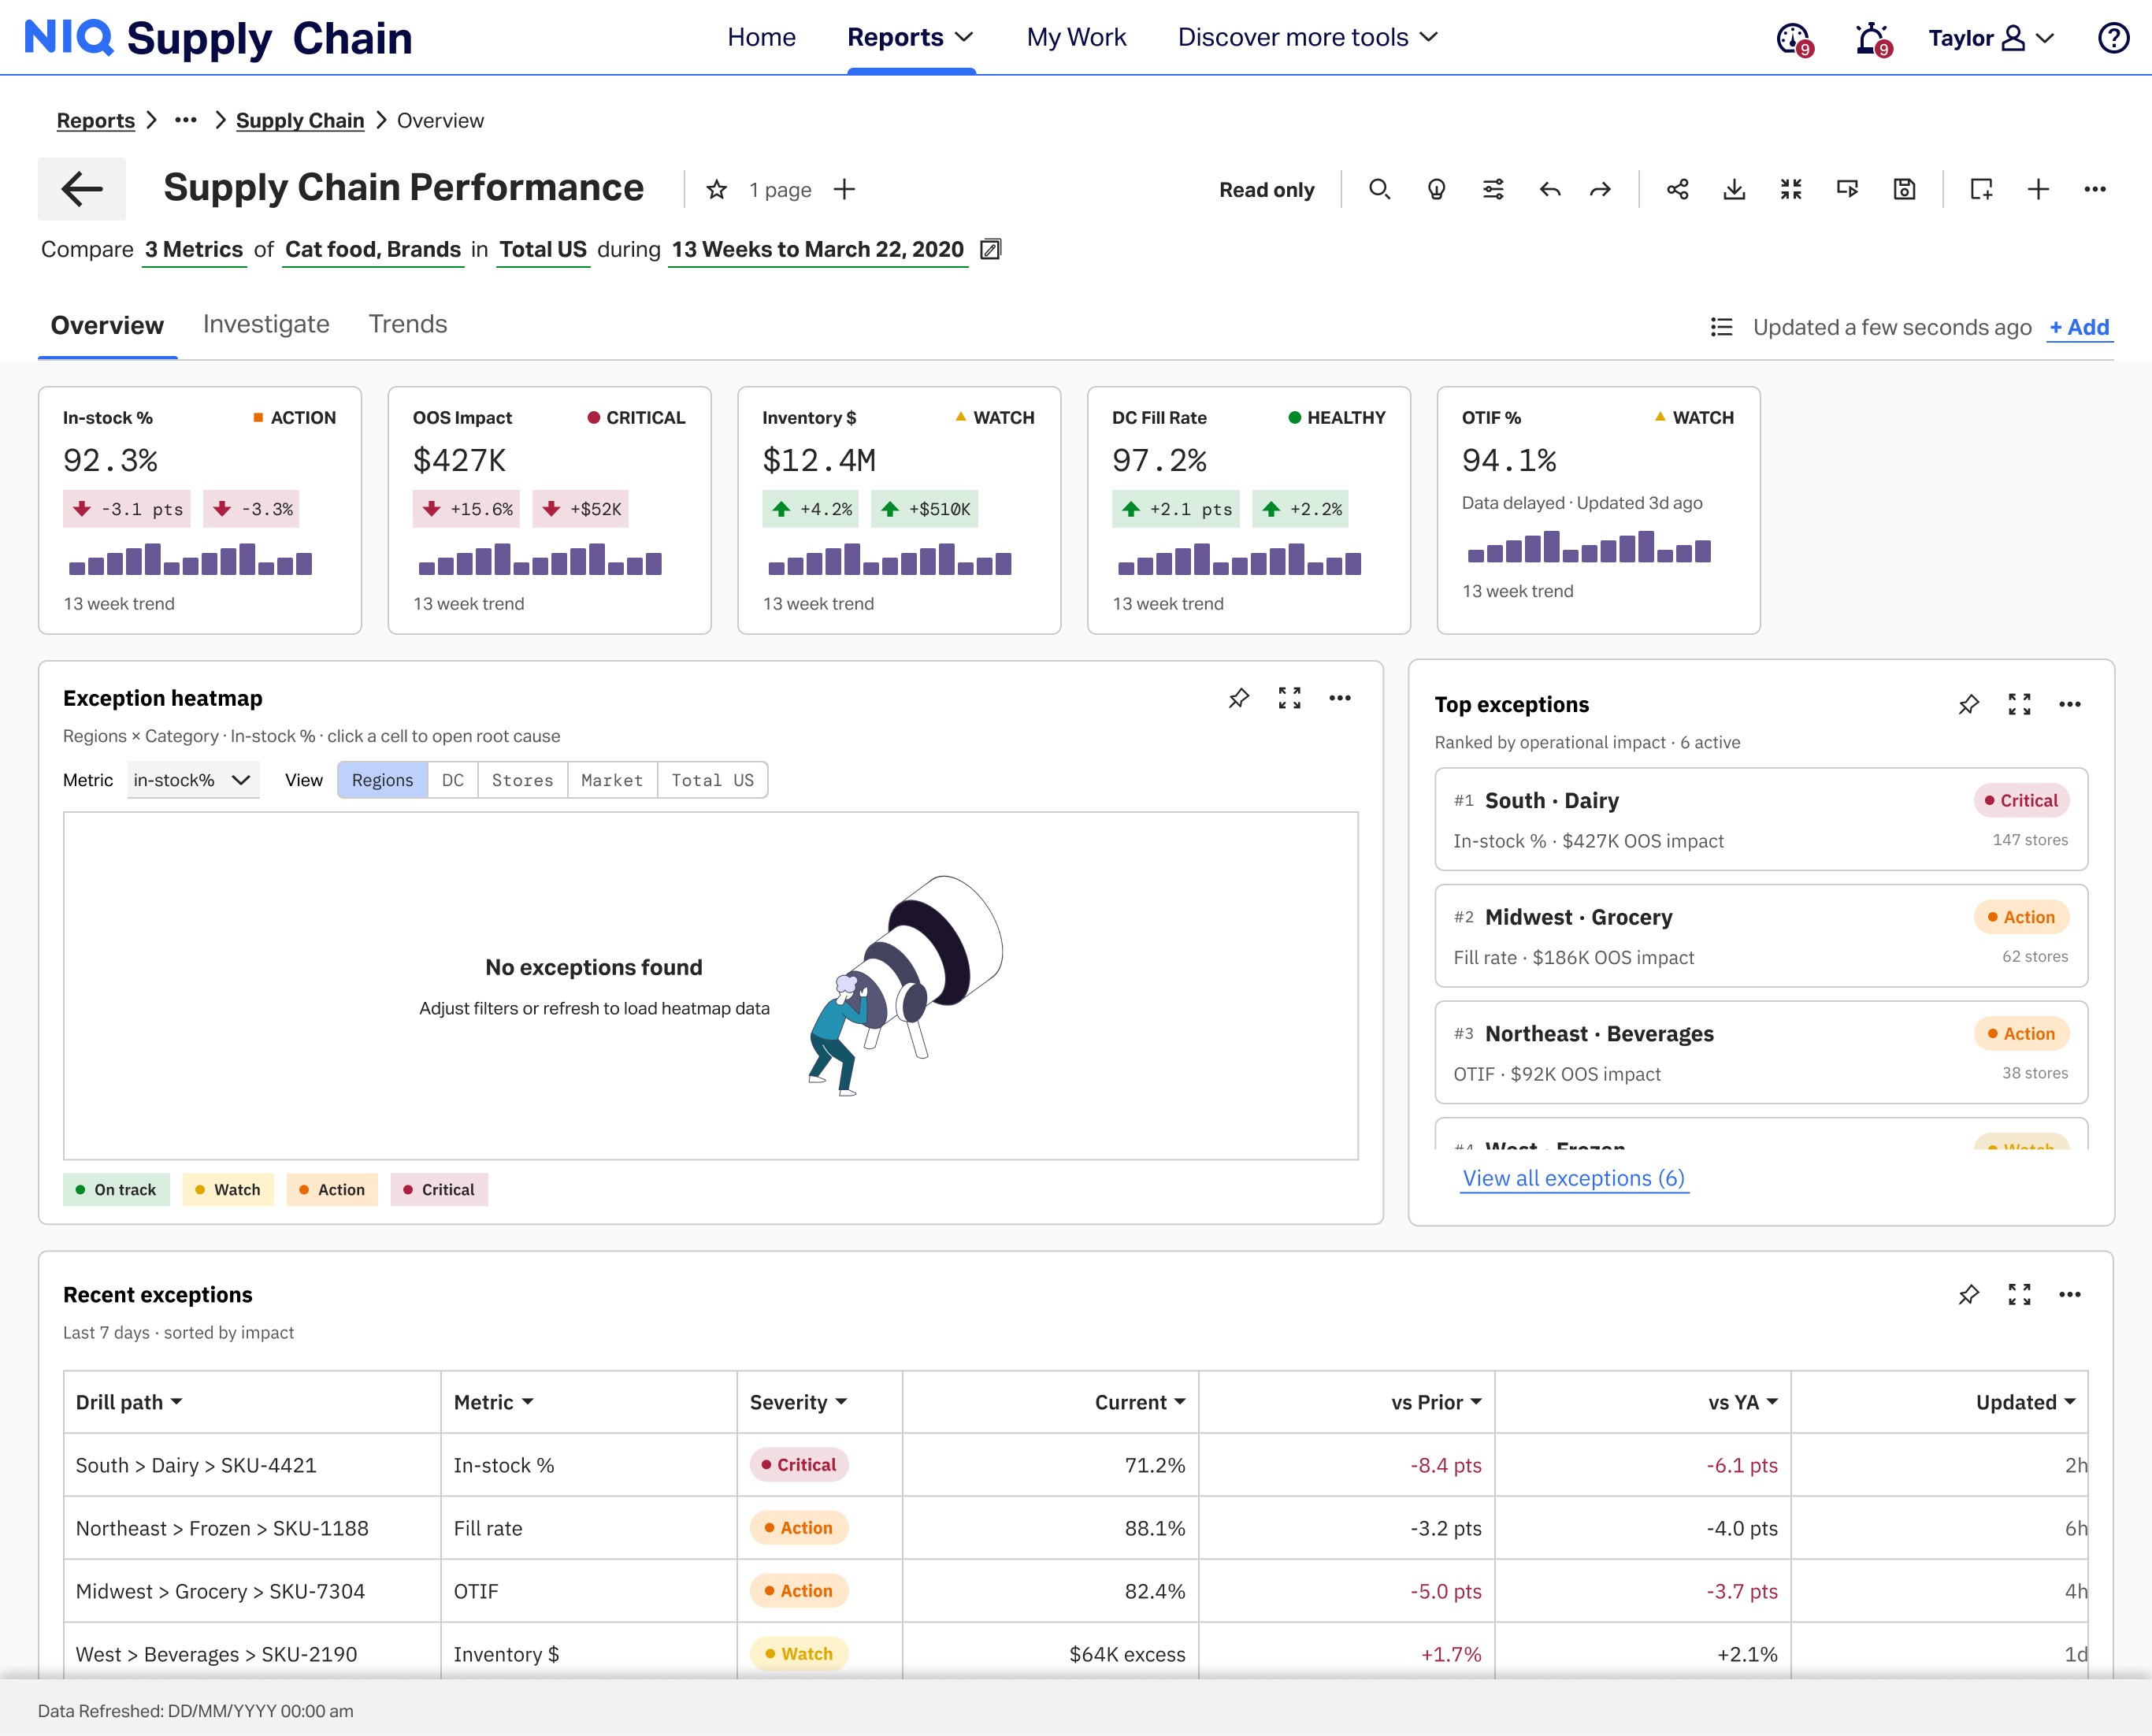
Carry filters and hierarchy through Product → Store → DC drill-down.
Interface behaviorPath bar preserves context and active filters across levels.
Inventory path
View path →
Show prior period, YoY, benchmark, and peer-set comparisons before export.
Interface behaviorComparison matrix is visible in-line with consistent metrics.
Product A · Store 214
| Metric | Current | Prior | Signal |
|---|---|---|---|
| On hand | 12.4K | 11.8K | ↓ |
| Sales | $428K | $401K | ↑ |
| Velocity | 2.1 | 2.4 | ↓ |
Package issue, exposure, locations, confidence, and next action into a review snapshot.
Interface behaviorOne-click snapshot compiles the right evidence and recommended action.
Review packet
Share packet →
[07]Product decisions
The strongest story here is not that every idea worked. It is how scope was reduced without removing the investigation depth teams depended on.
A KPI-first dashboard
Exception queue
Keep the KPI strip compact and let operational exceptions lead.
Separate root-cause flows
Use one persistent drawer that can open from a KPI, heatmap, queue, or row.
Full drill tables on Overview
Comparison matrix
Keep Overview scannable and move hierarchy depth into Investigate.
Four tabs by default
QBR snapshot
ReadyUse Overview, Investigate, and Trends as the core. Keep Distribution conditional.
[08]Convergence
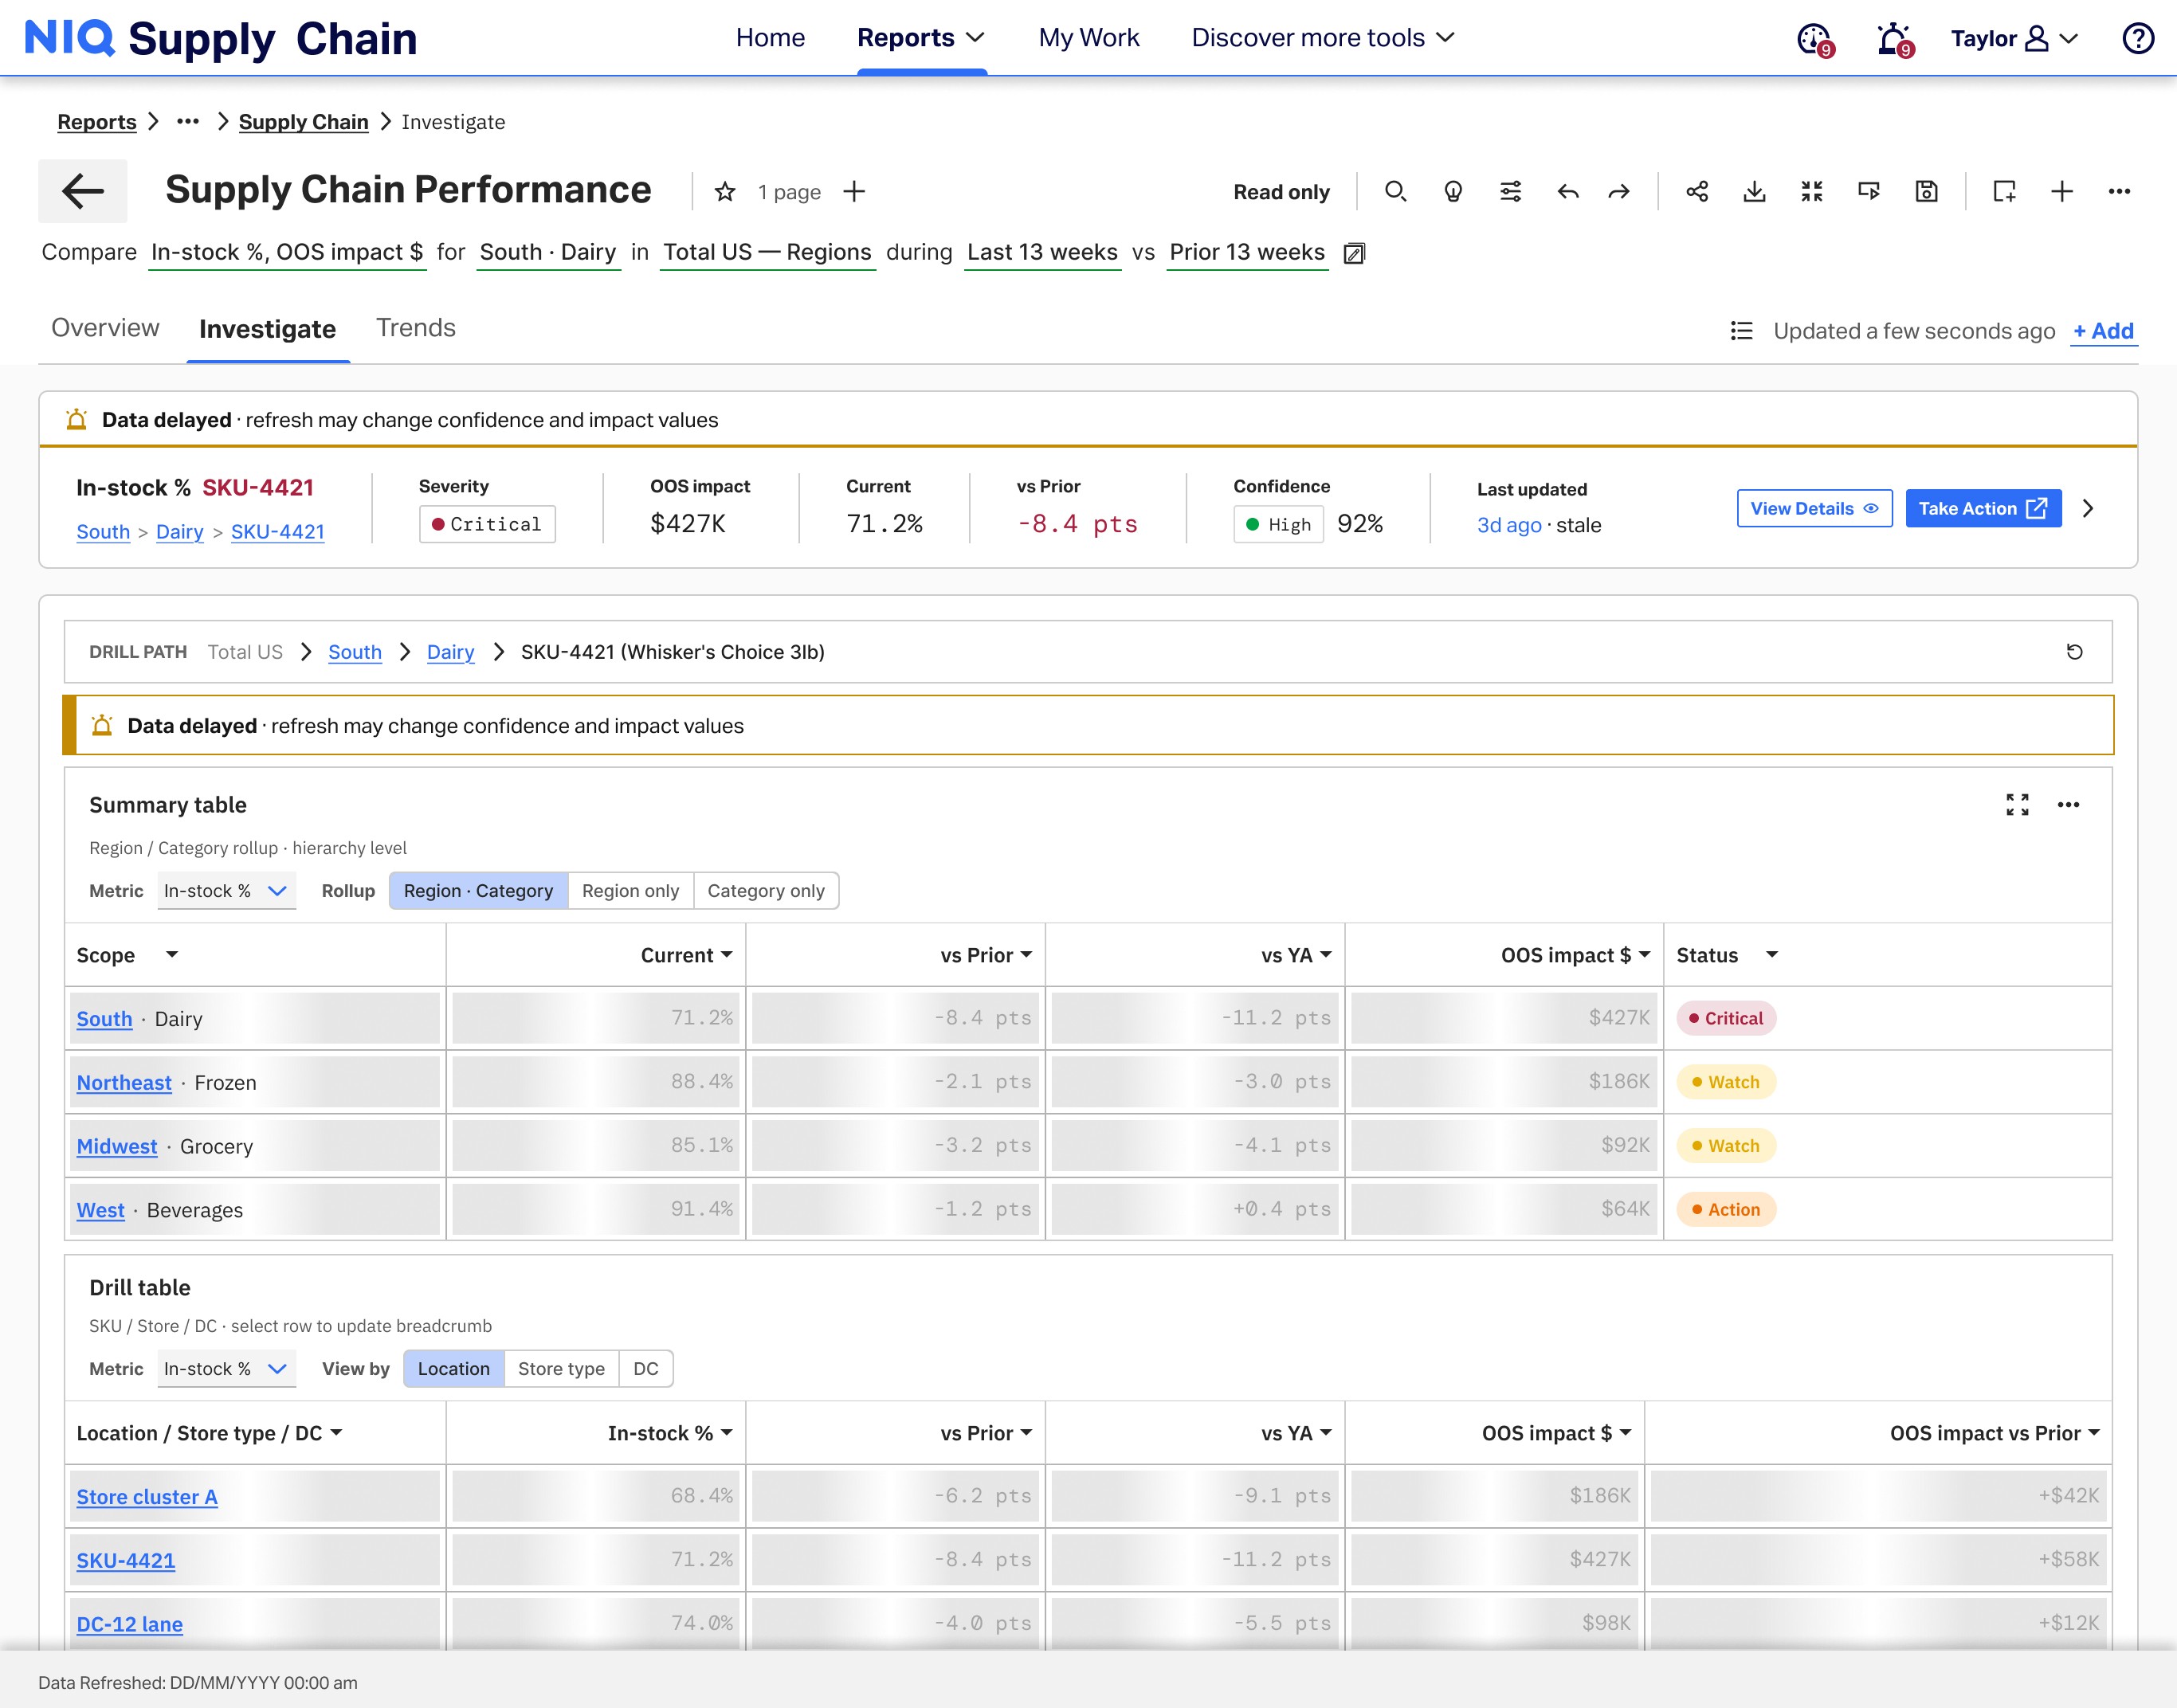
Low-fidelity sketches tested one continuous investigation path before the final tabs were assembled.
Exception queue
| Issue | Impact |
|---|---|
| Stockout risk · Dairy | 98 |
| OTIF drop · Region West | 86 |
| Velocity anomaly | 72 |
| Overstock signal | 64 |
Full table below
Surface the highest-risk exceptions before the full inventory table.
Investigation lens
Preserve product, store, DC, period, and issue context.
Affected locations
| Location | Variance |
|---|---|
| Store #1142 | –4.2pp |
| Store #0891 | –2.1pp |
| Store #2204 | –0.8pp |
Show the operational driver behind the exception.
Review packet
Validate the finding before it becomes review evidence.
This sequence became the interaction contract for Overview, Investigate, and Trends.
[09]Workflow
Reusable modules handled risk concentration, exception triage, hierarchy drill-down, and stale-data handoffs.
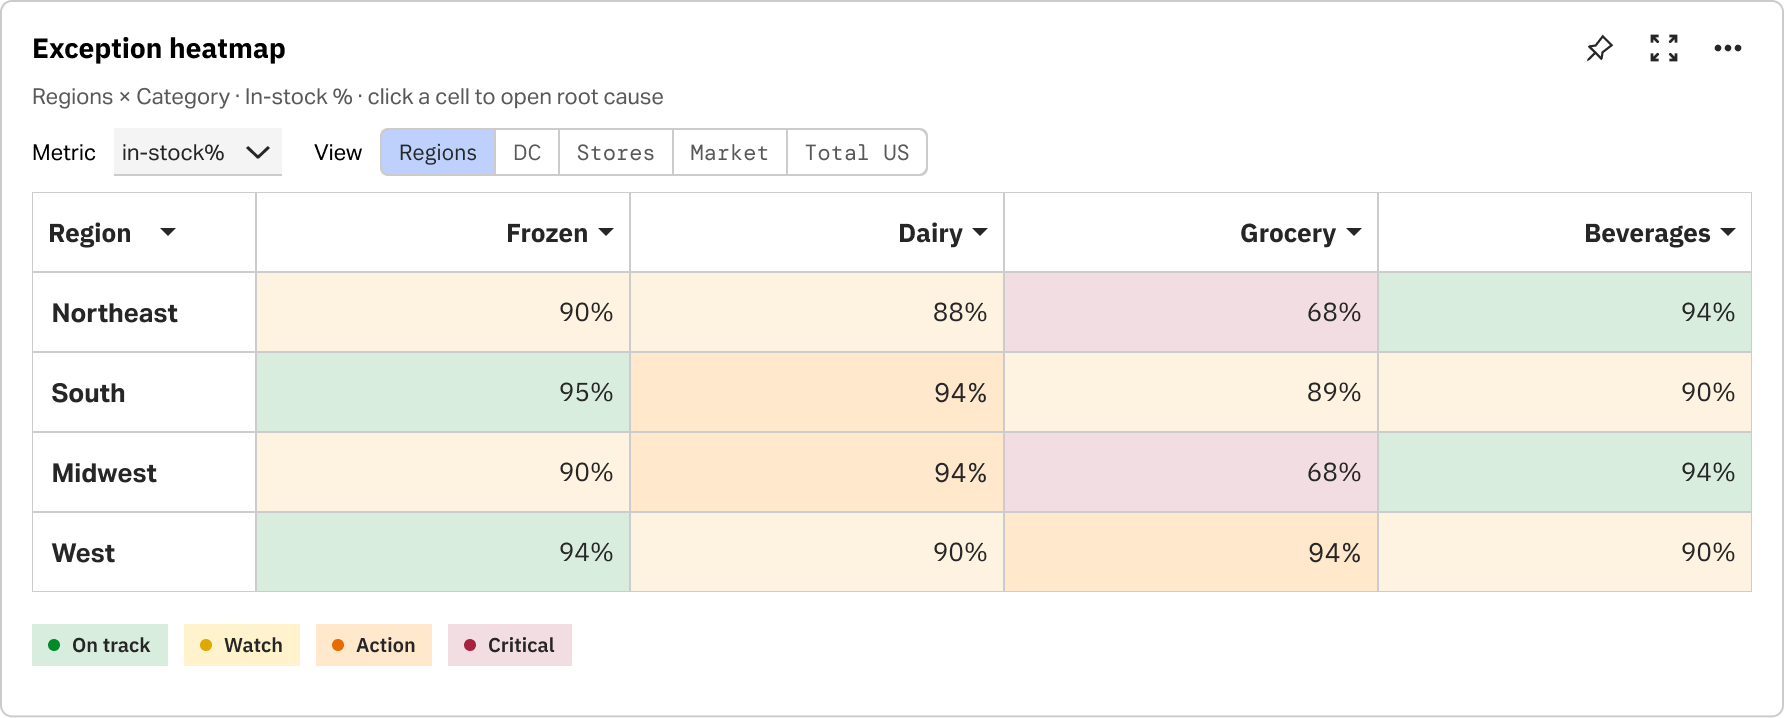
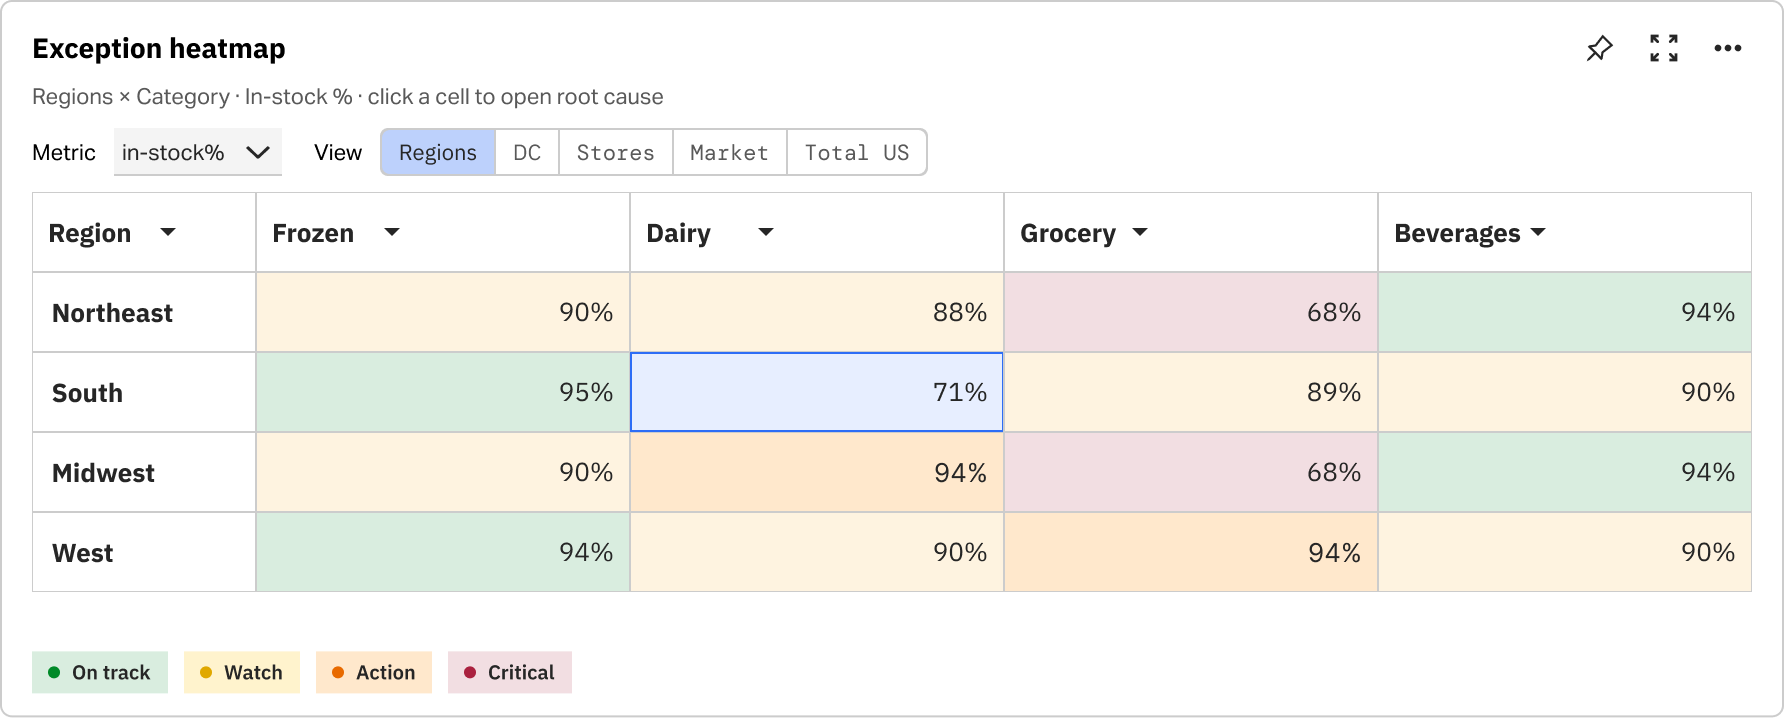
Risk concentration
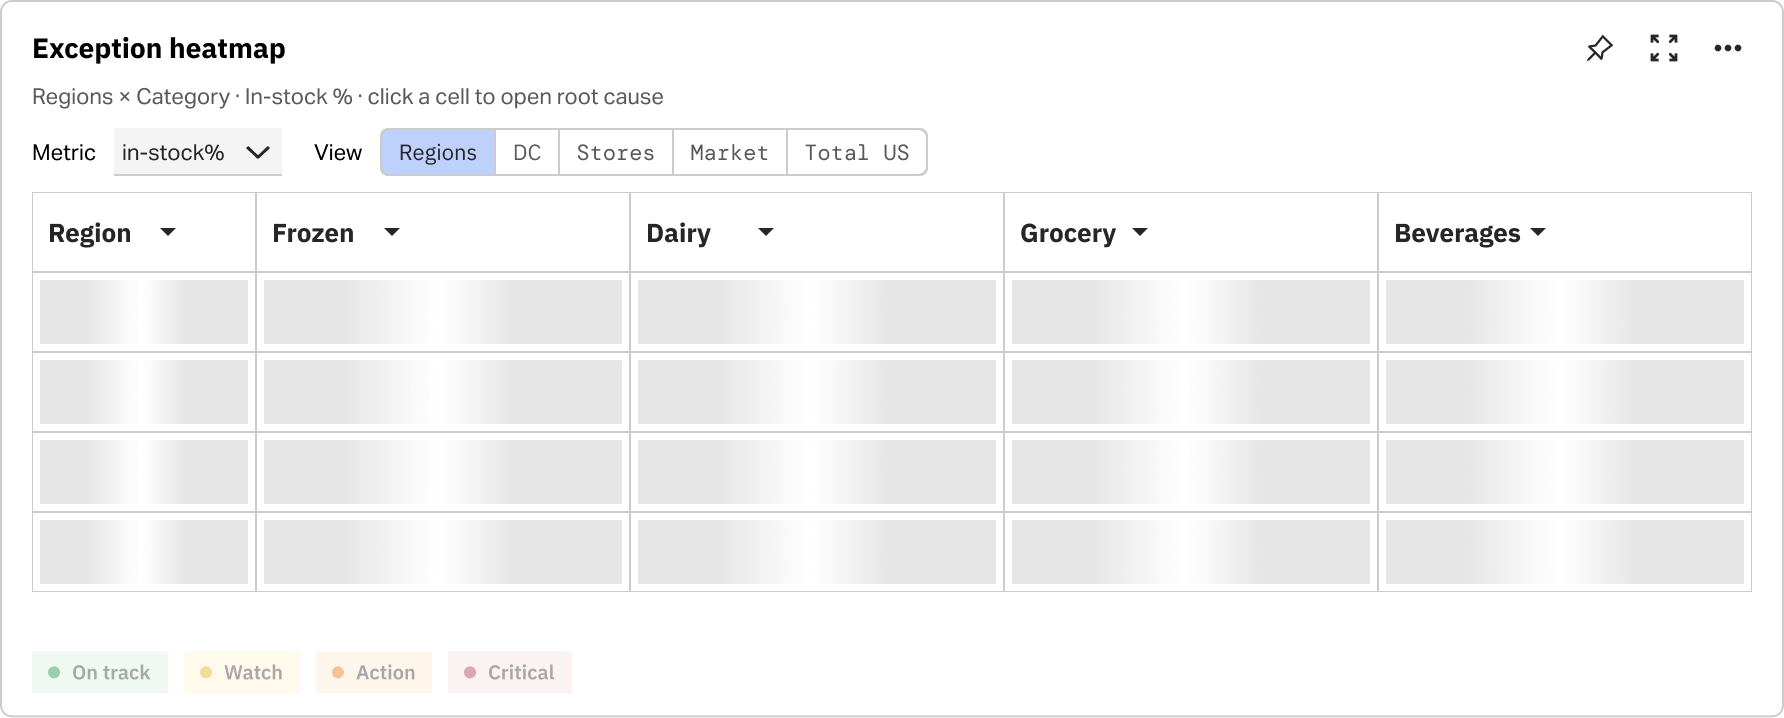
Teams scan region × category performance in one view, then focus a cell to investigate without losing surrounding context.
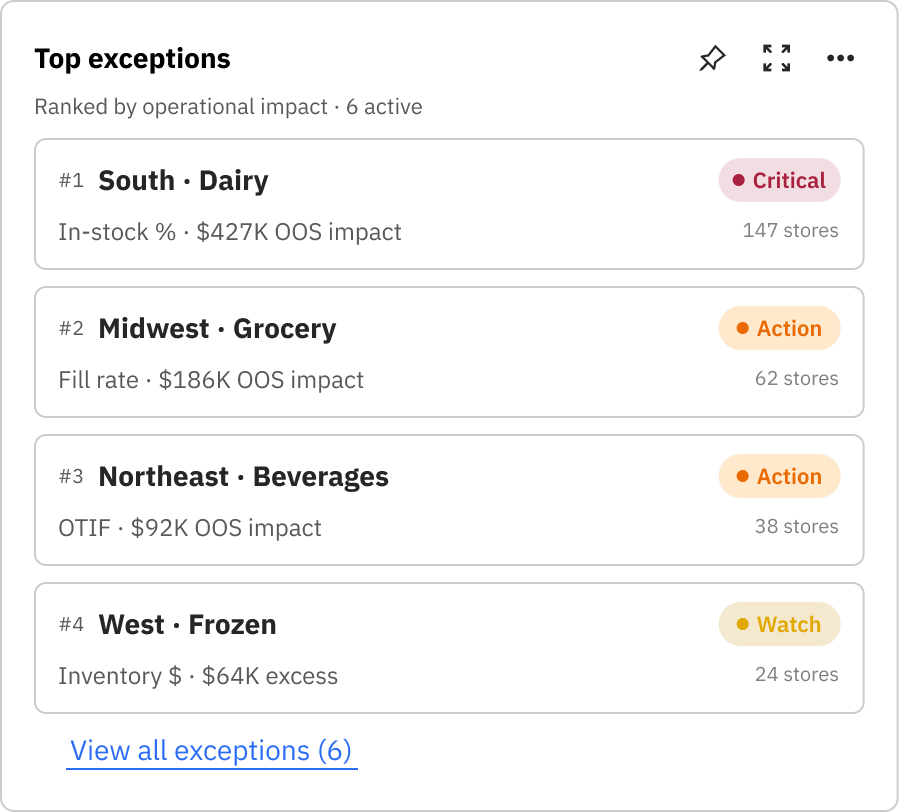
Exception queue
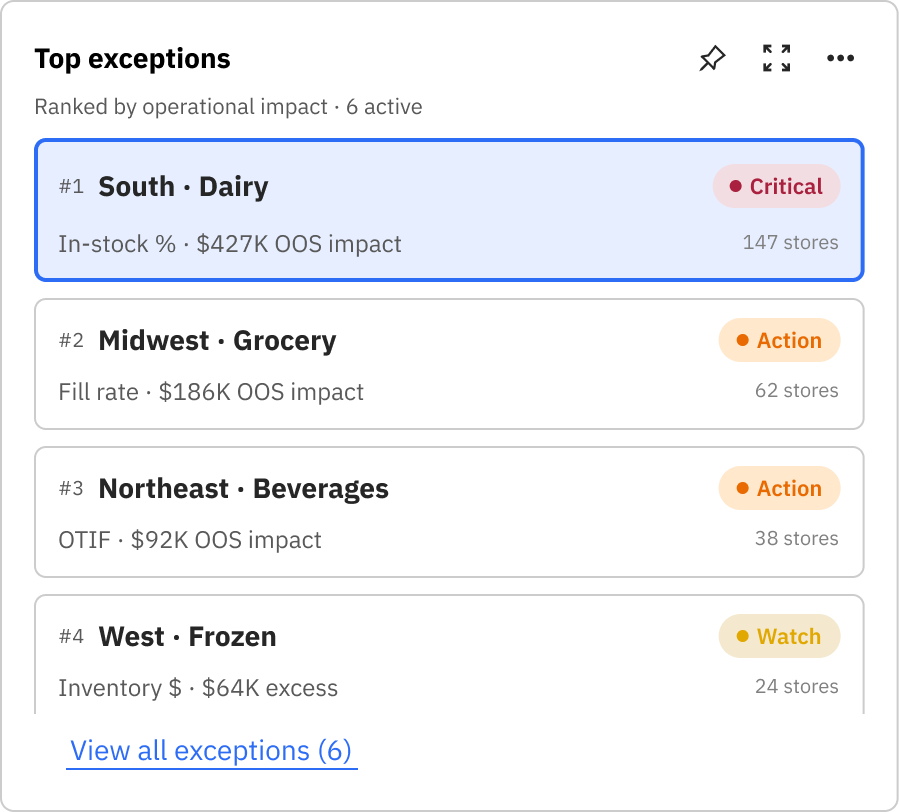
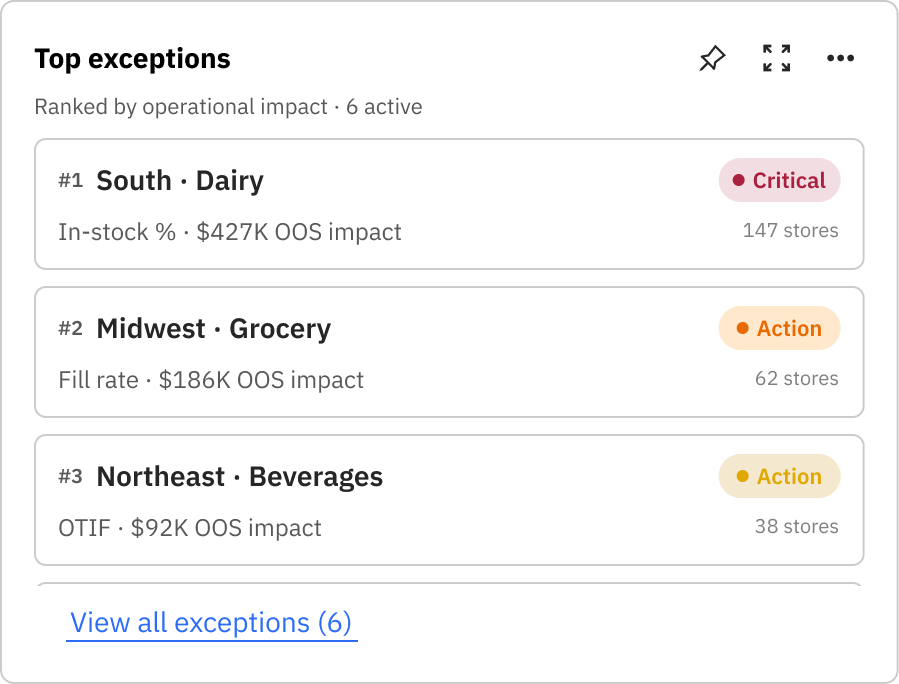
Exceptions surface by severity so analysts triage stockout and velocity risk before opening the full report.
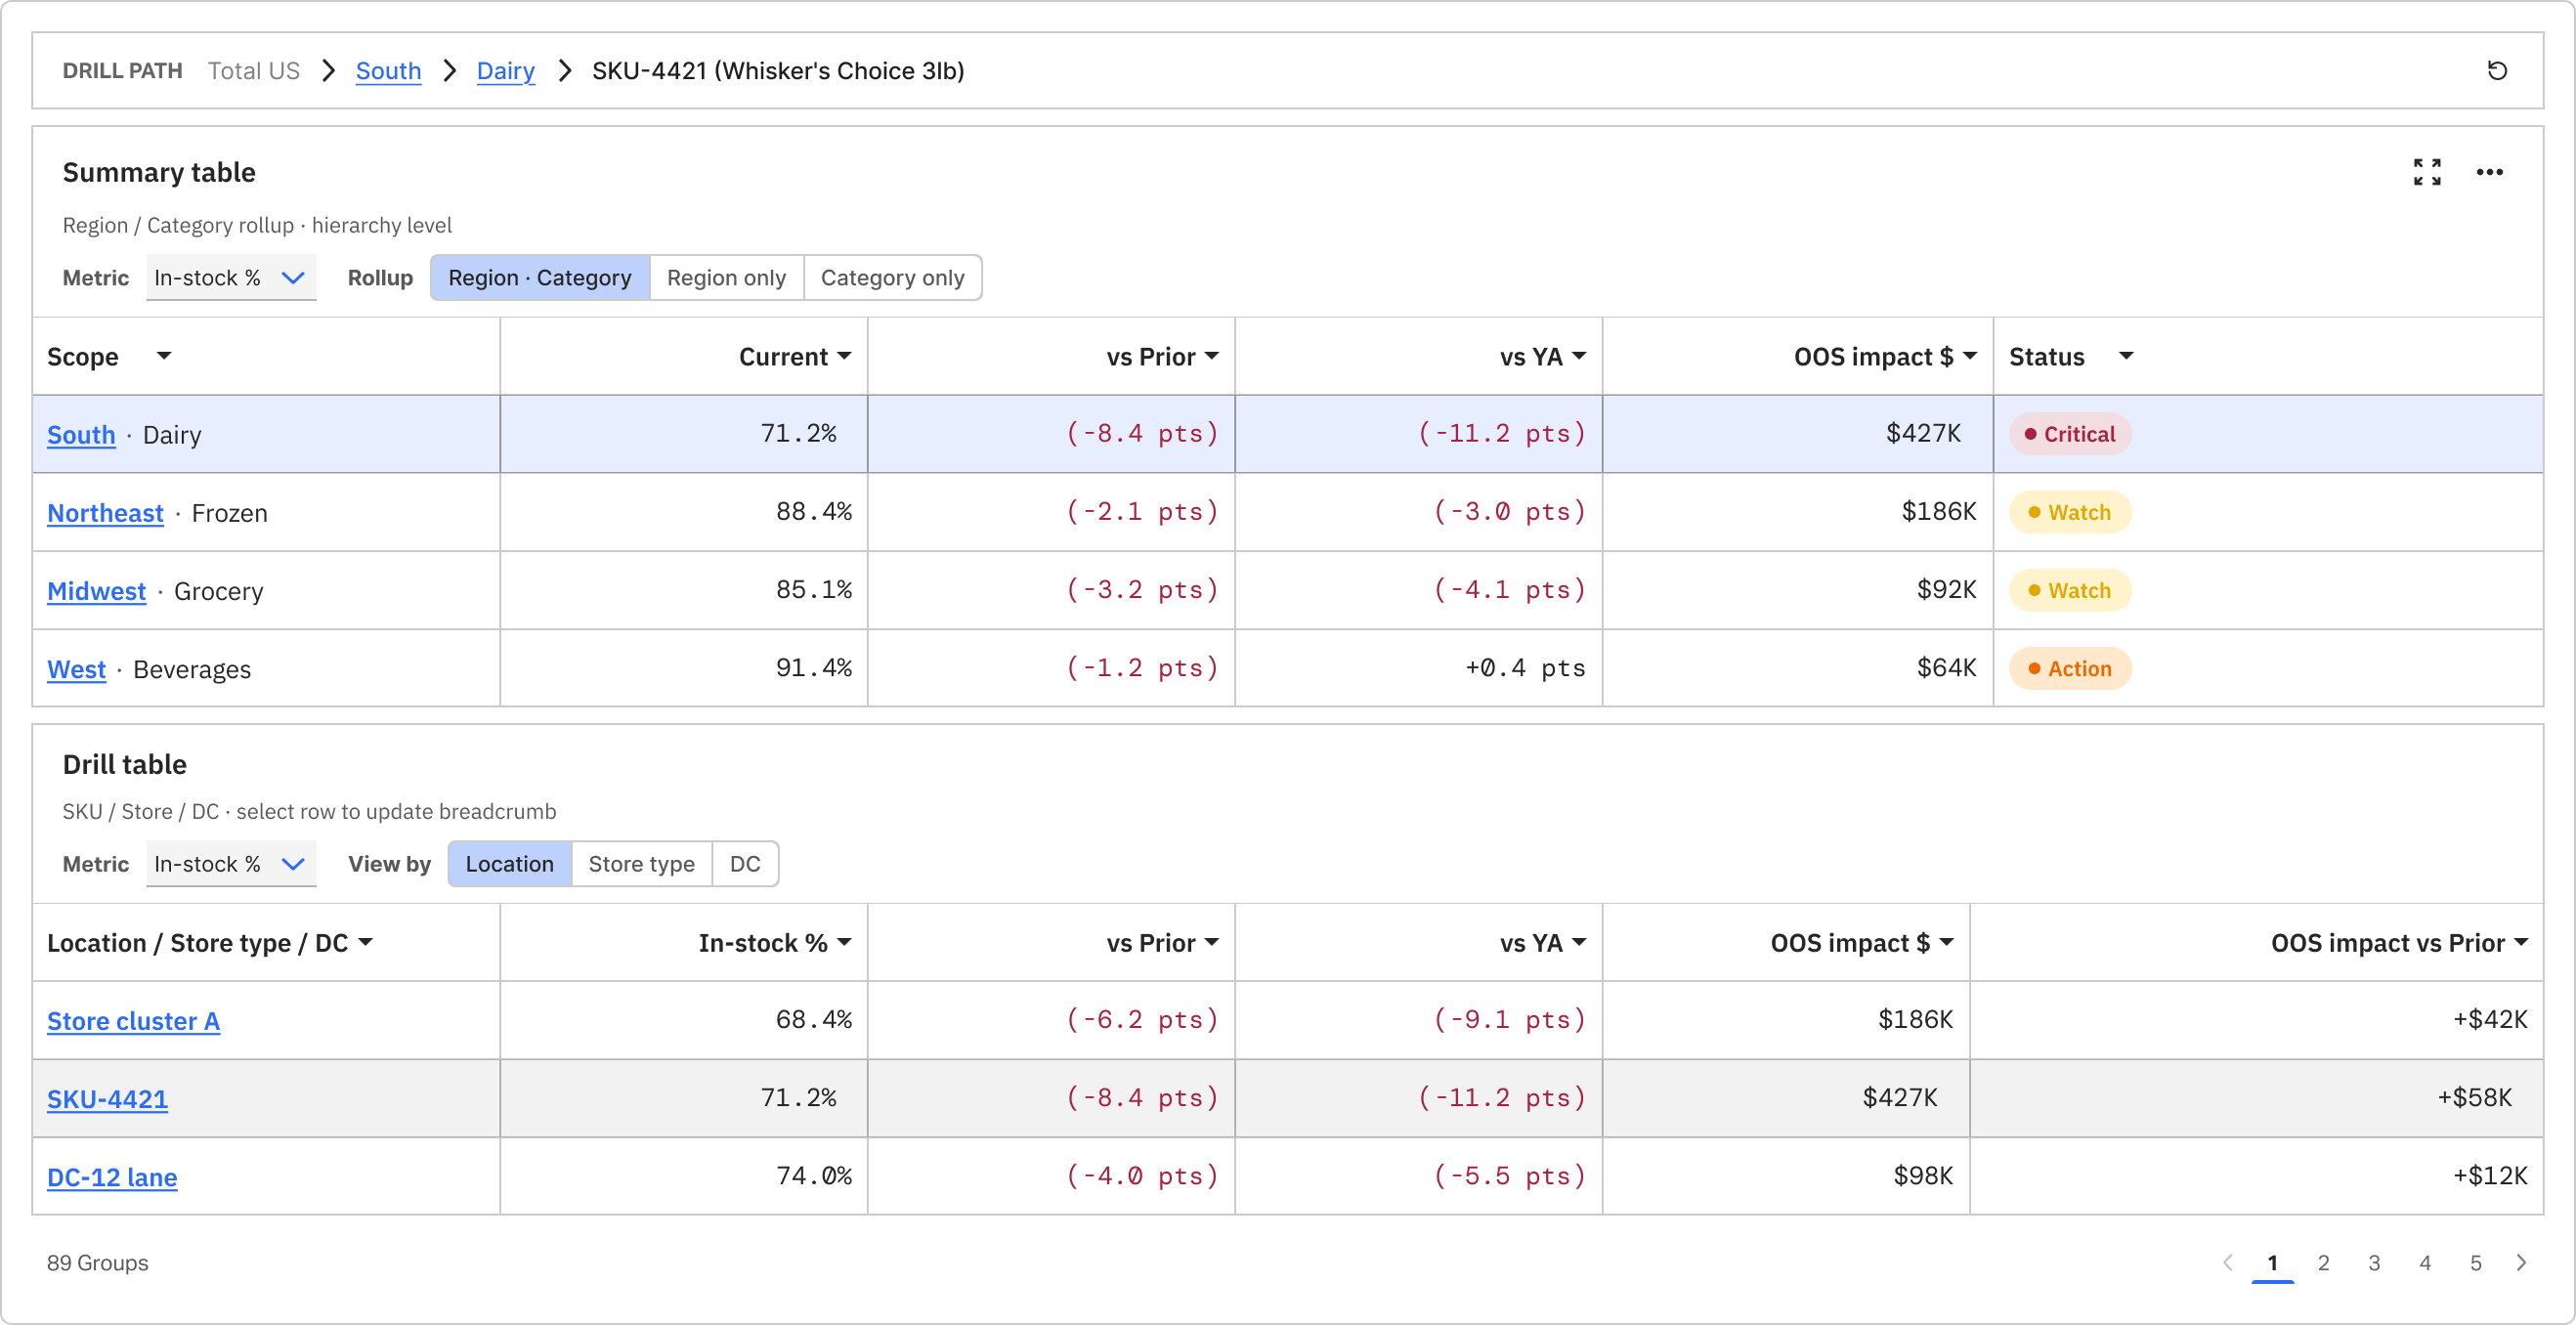
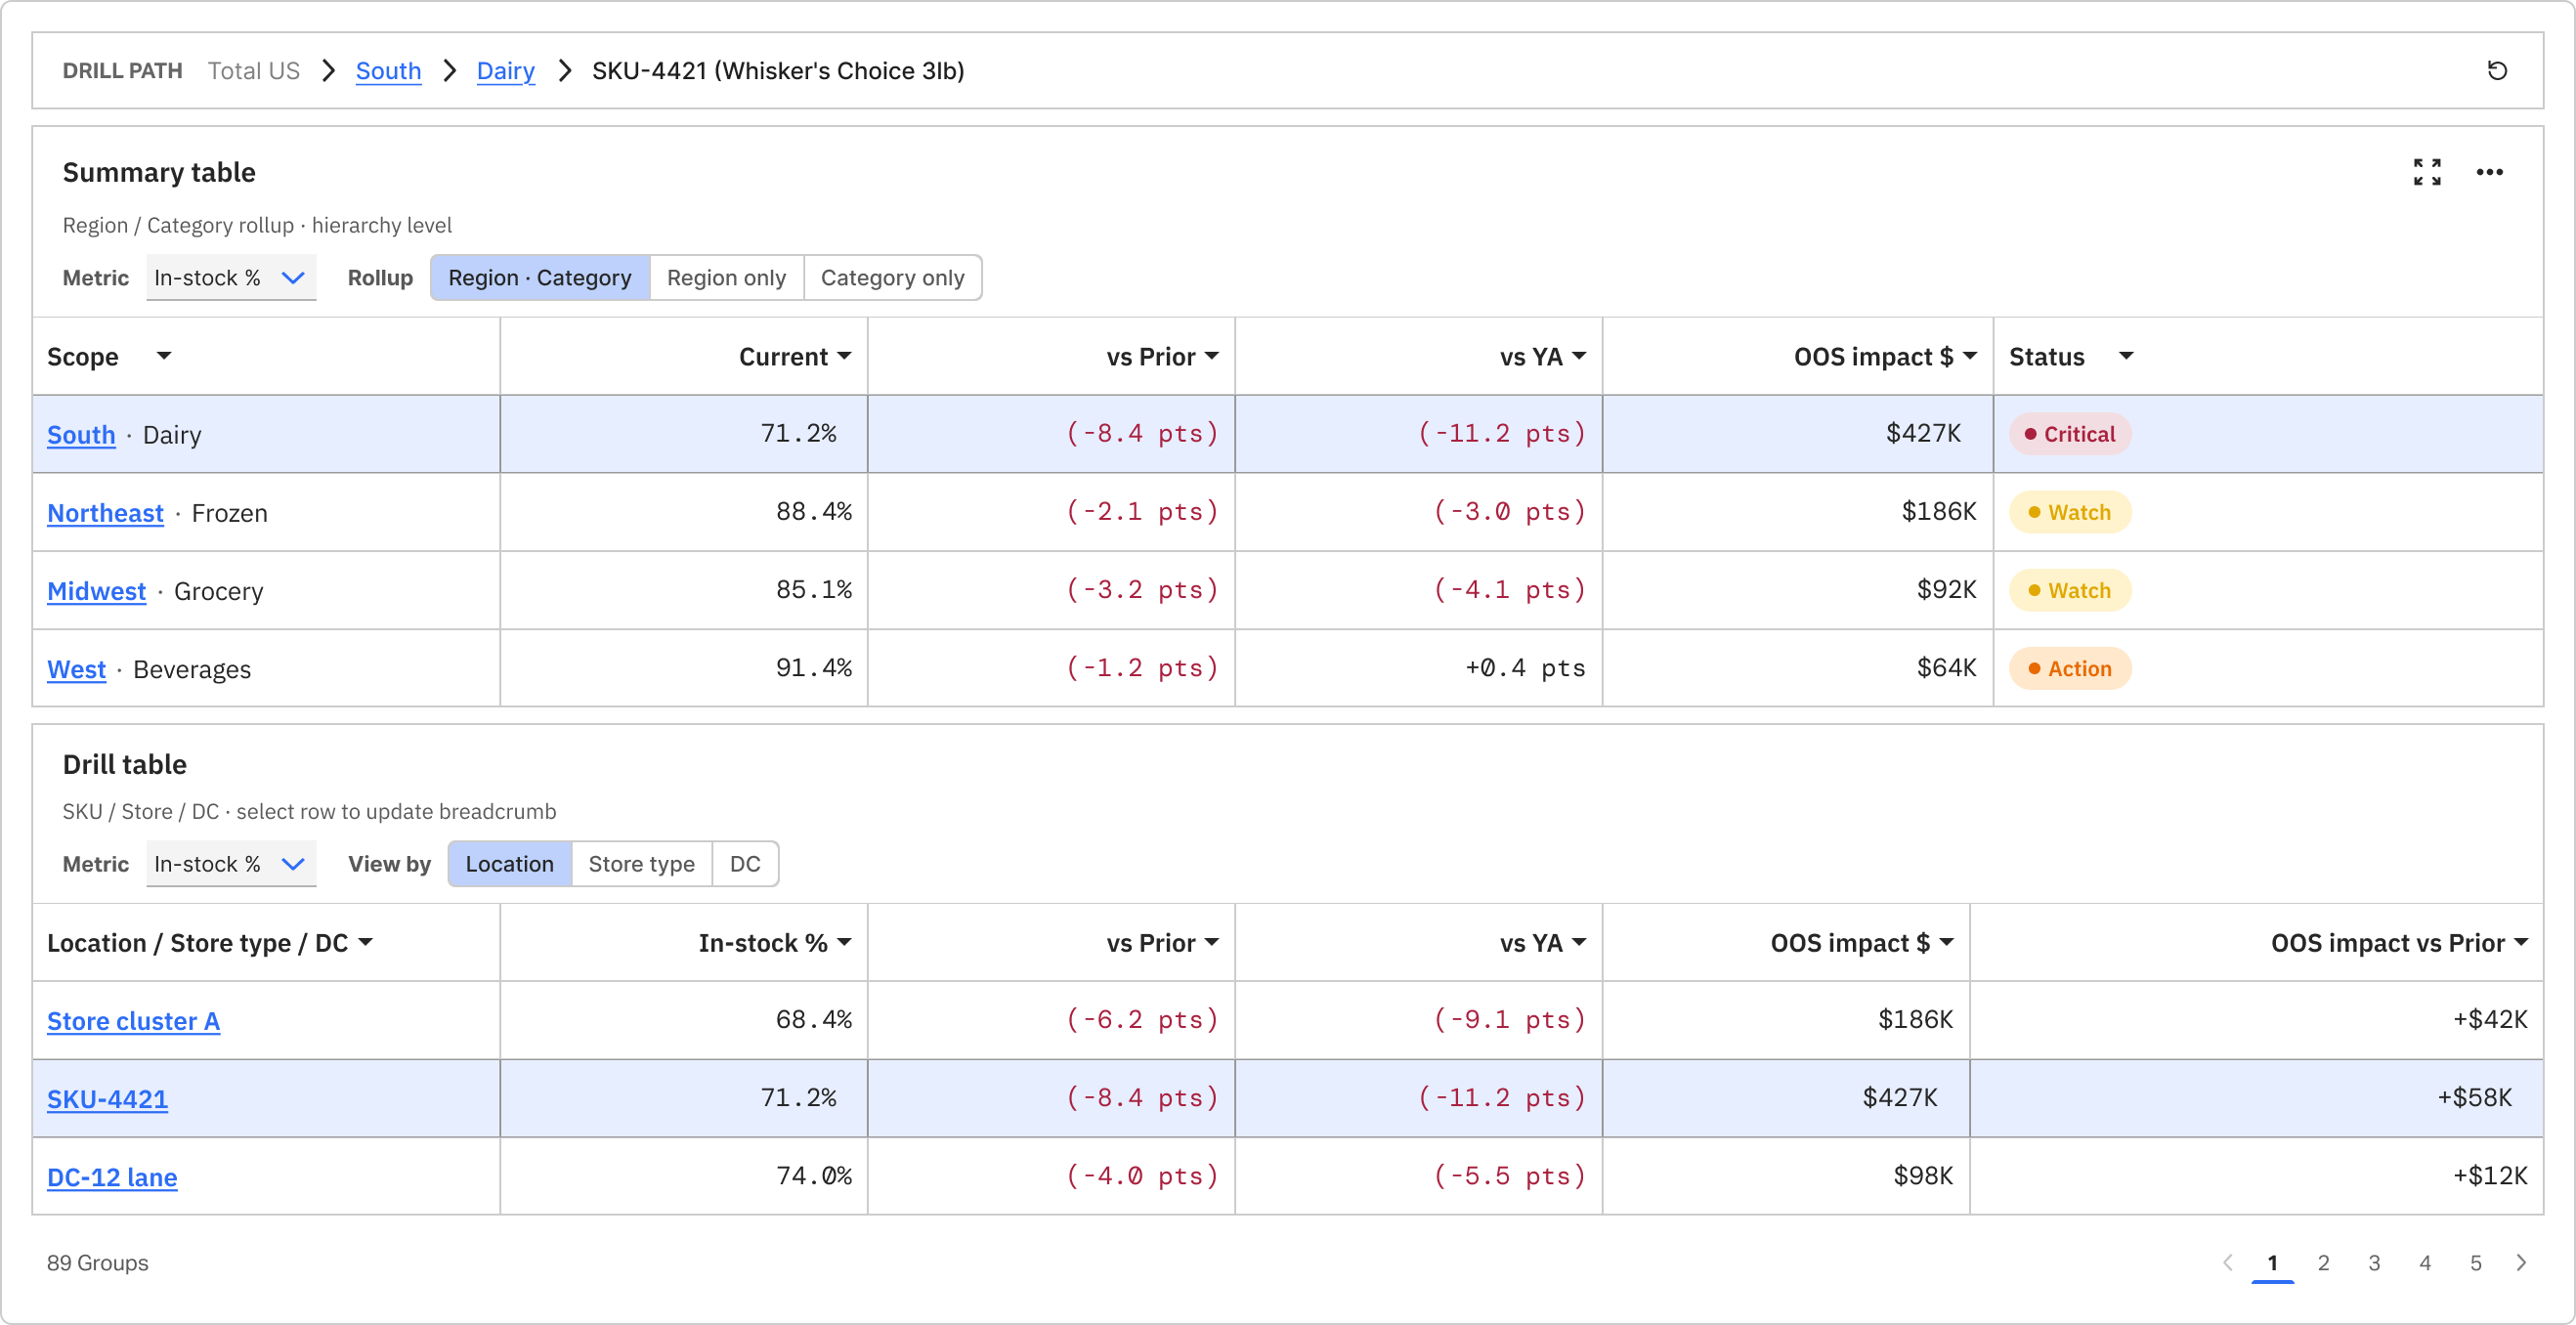
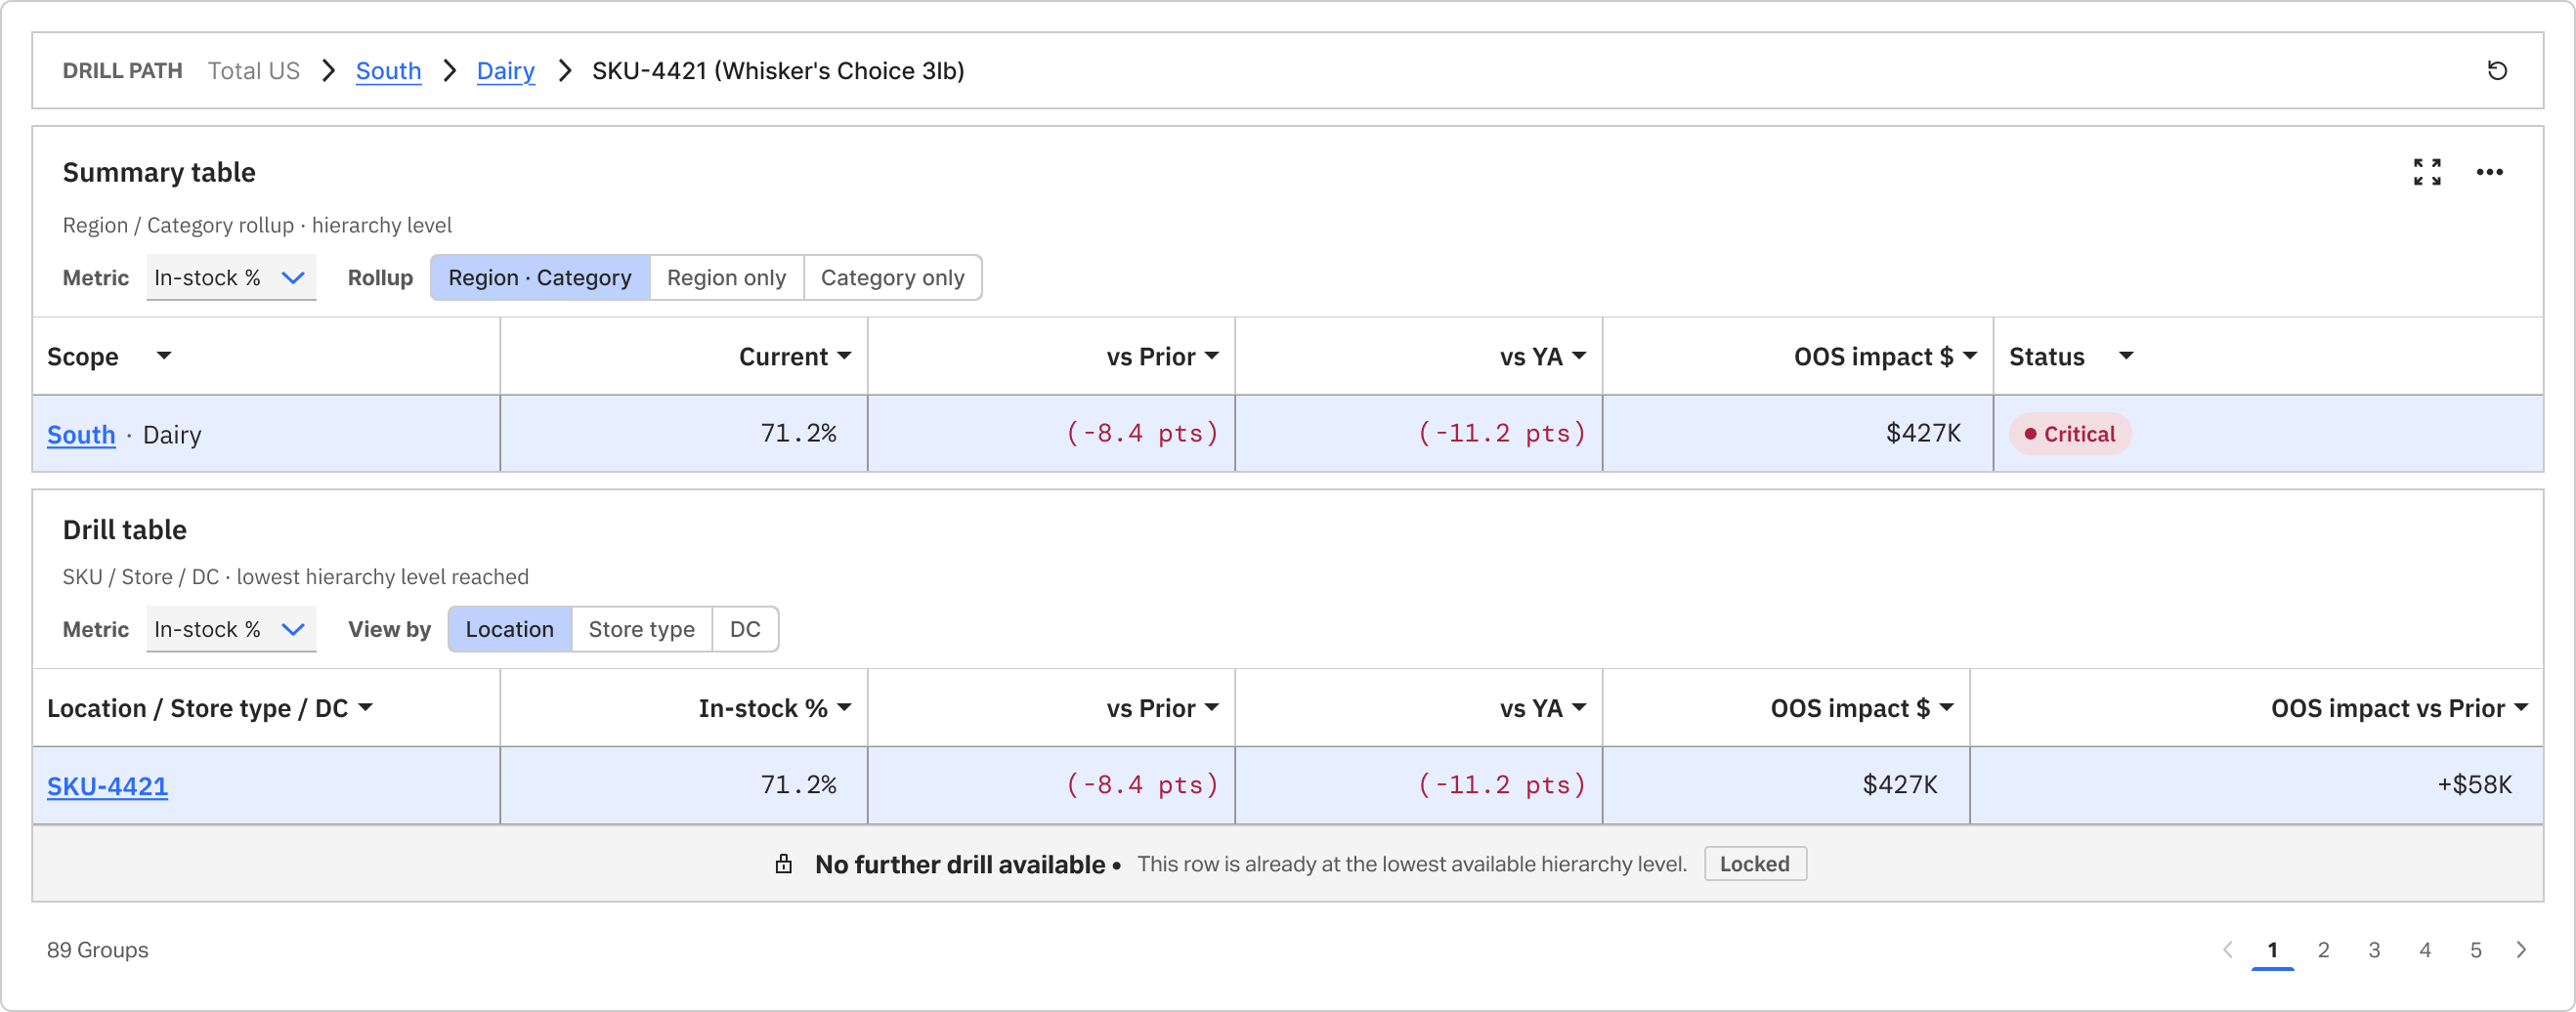
Drill stack
Parent and child tables stay linked as users drill — with clear end-states when the hierarchy cannot go further.
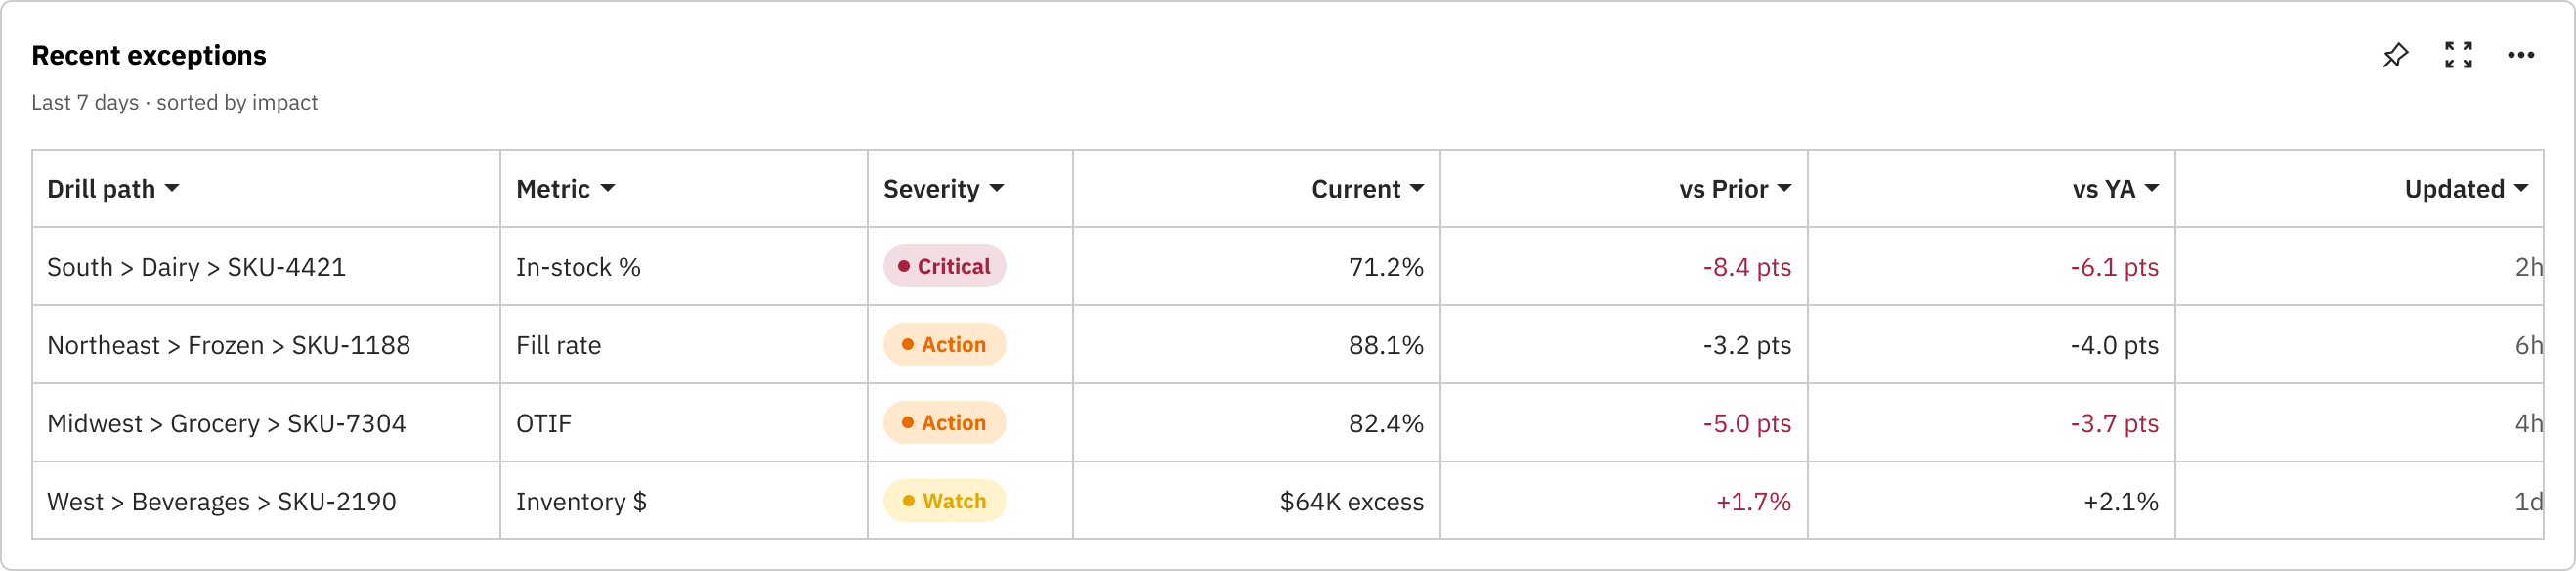
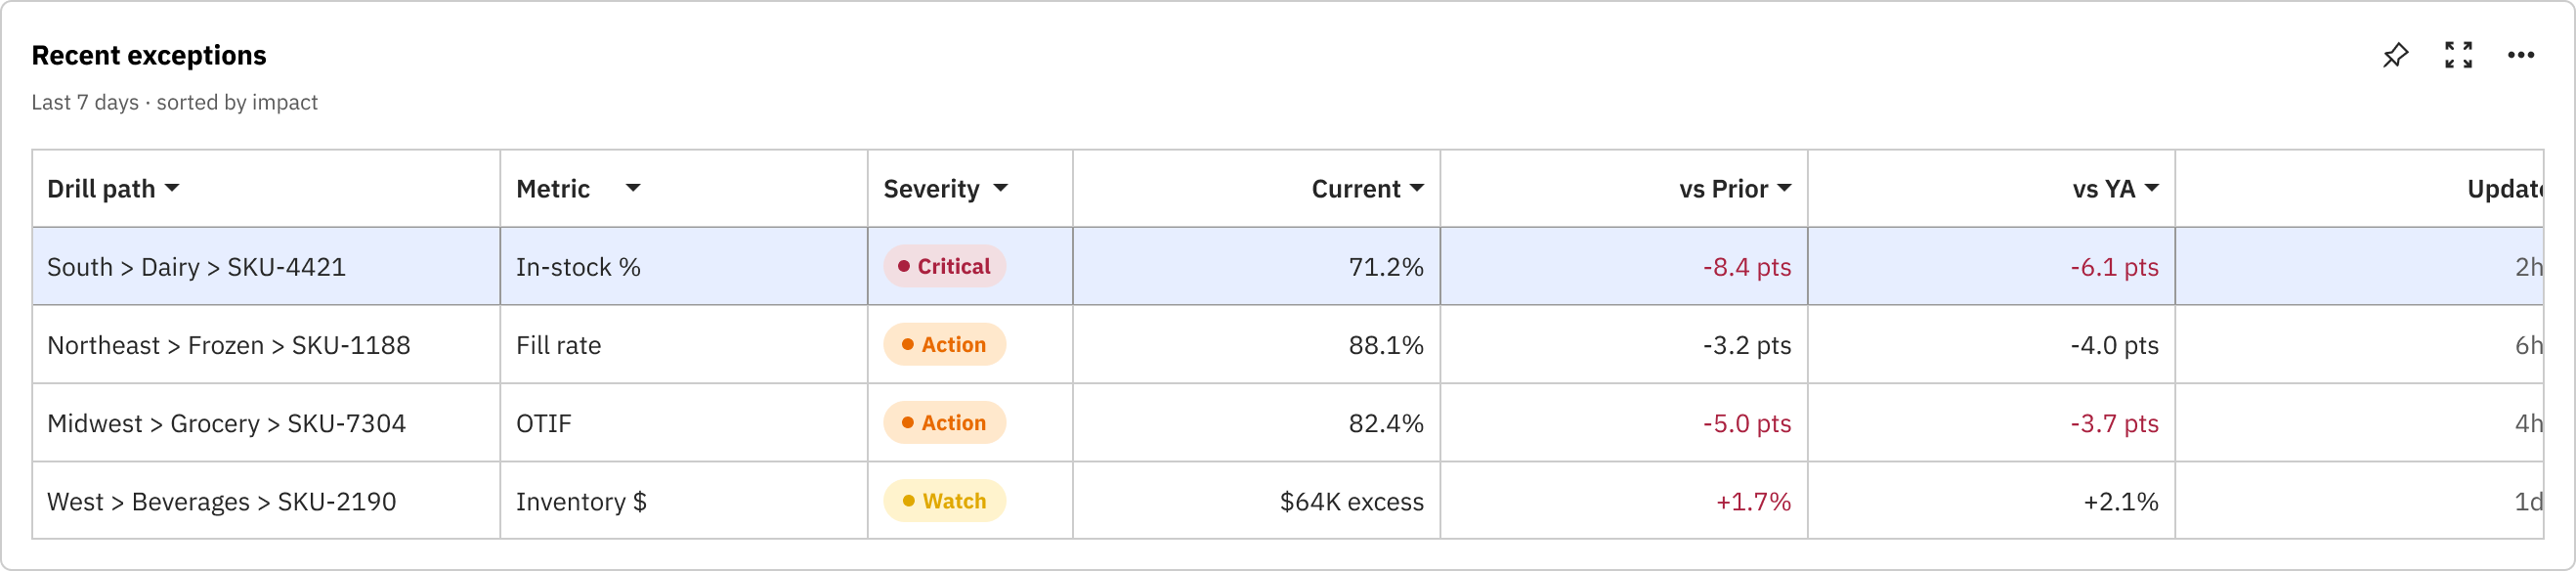
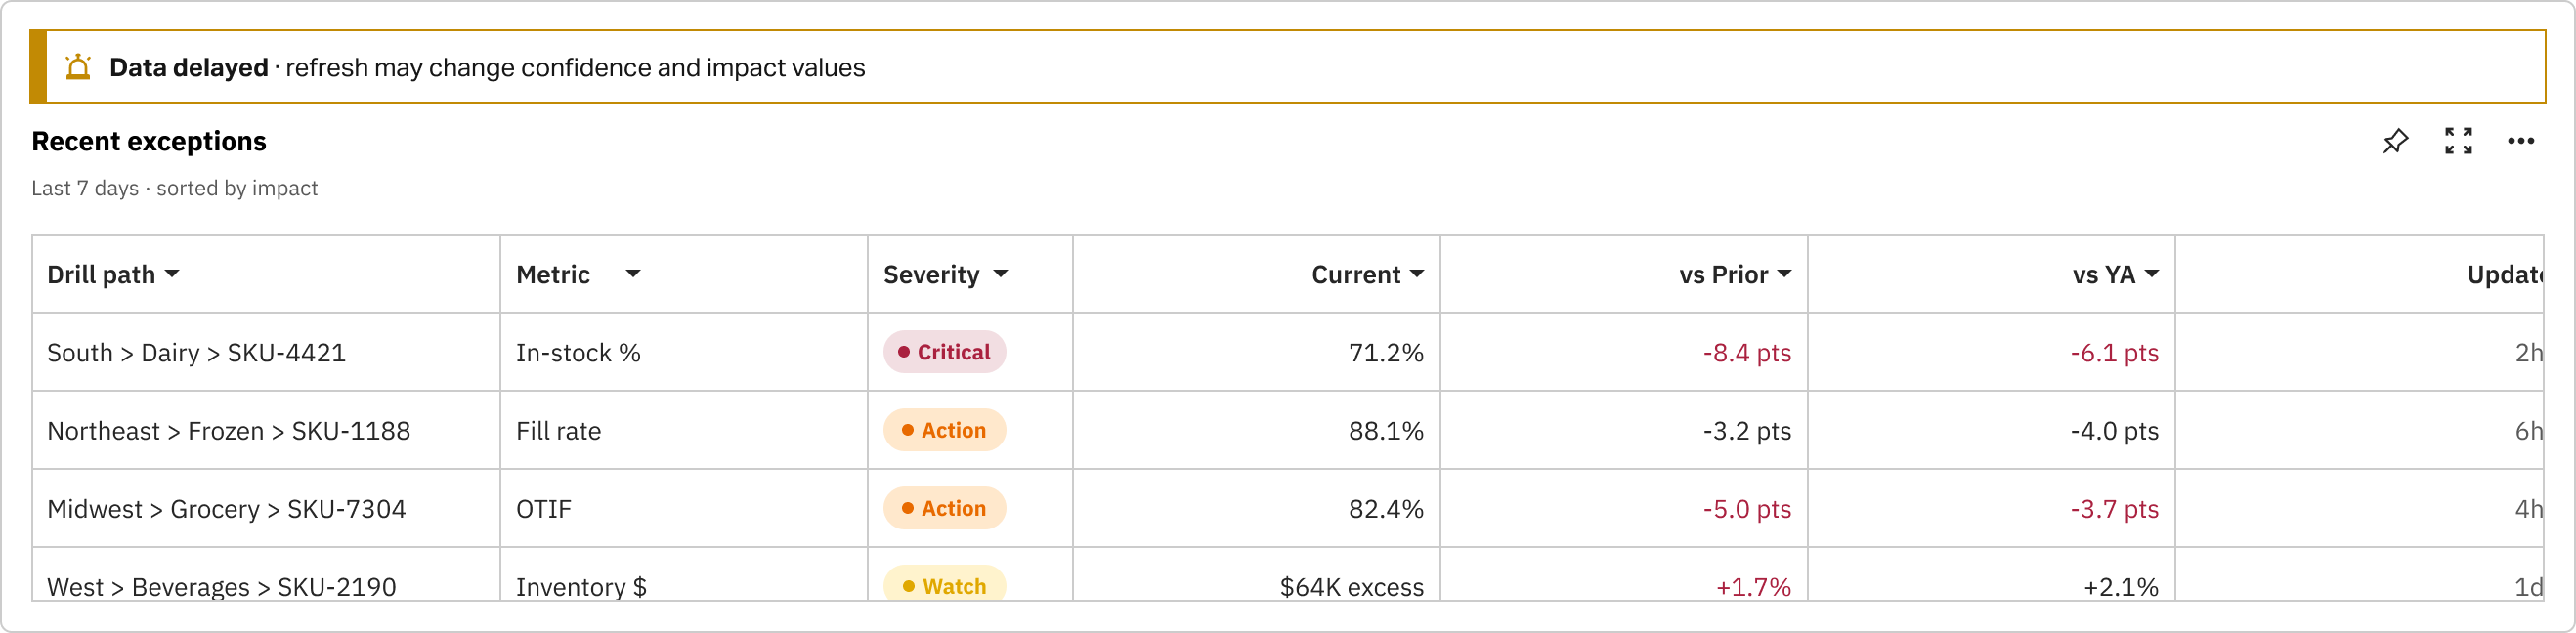
Recent exceptions
Recent exceptions keep severity, path, and data-trust signals visible so review handoffs do not start from a blank export.
[10]Framework
Overview directs attention. Investigate preserves depth. Trends tests whether the change is temporary or structural.
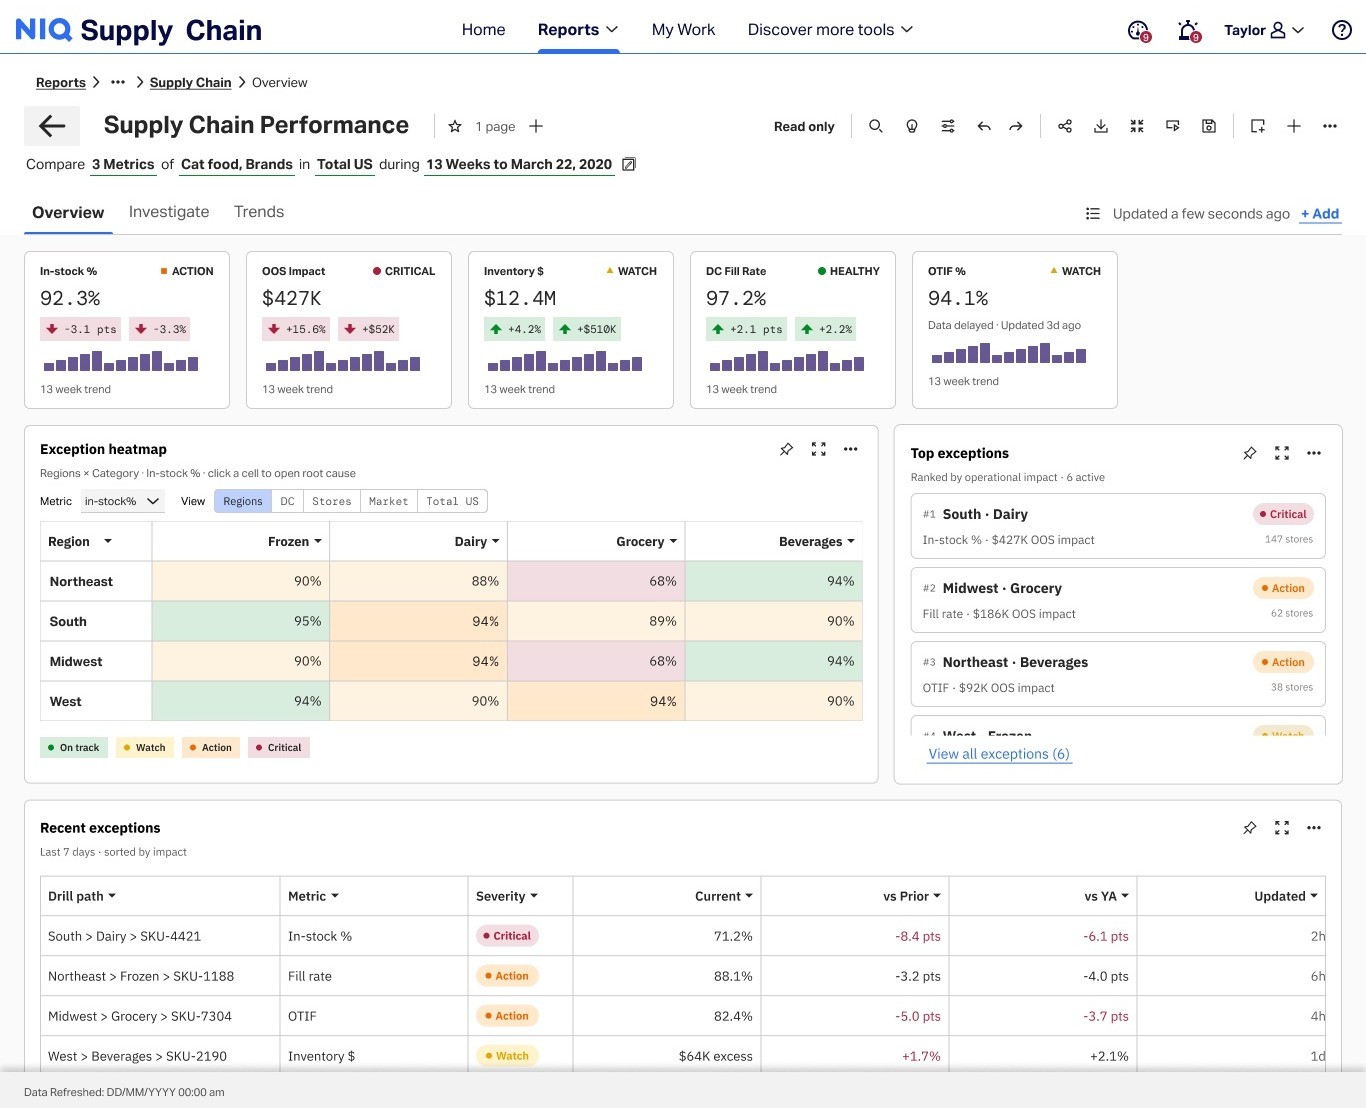
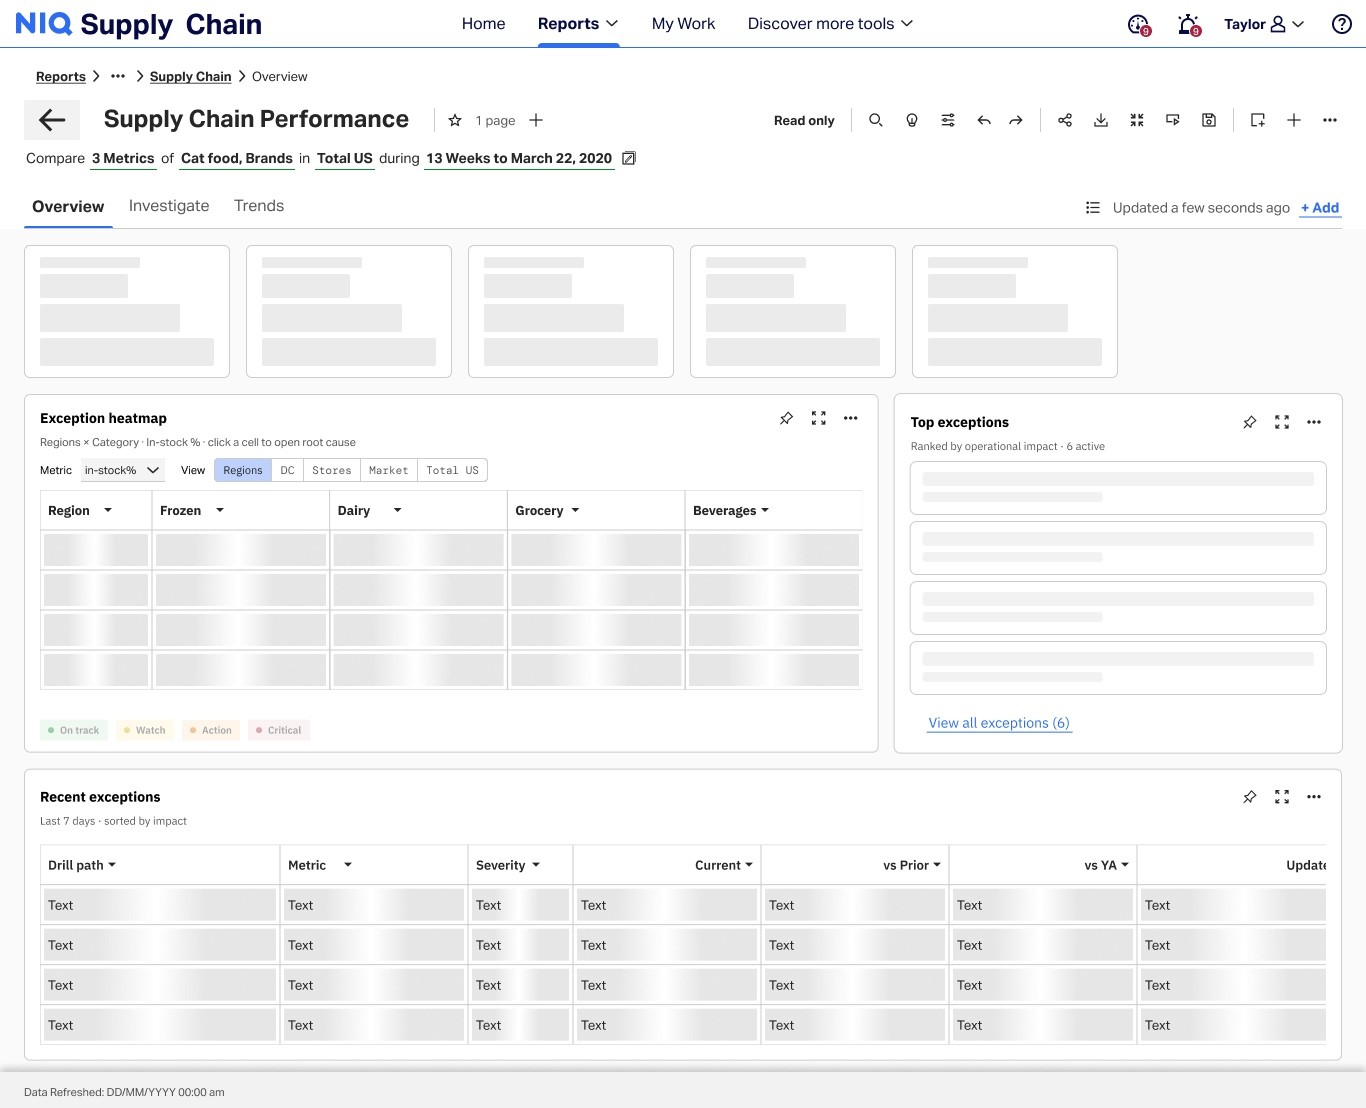
Exception Overview
The overview tab became the business entry point — where risk concentrates, which KPIs need attention, and what to review before drill-down or escalation.

Path 01 of 03: See risk instantly
[11]Validation
Each method was tied to a concrete product decision. The useful evidence is what changed next.
Mapped where filters, hierarchy, and time period were lost. The redesigned report preserved all three across the investigation path.
Tested the order of attention and drill-down. The interface became one continuous path: scan, select a lens, drill, then validate before export.
Reviewed freshness, calculation context, and ambiguity. Confidence states moved beside metrics that carried review risk.
Compared raw exports with what managers needed to defend a conclusion. The final export became a QBR-ready snapshot.
[12]Impact
Four outcomes from the redesigned path — faster prep, surfaced exposure, quicker detection, and strong adoption.
QBR prep time-to-insight (from 4+ hrs)
Stockout exposure surfaced
Faster issue detection
Adoption among target users
[13]Next step
Inventory, supply, or exception systems — a focused sprint for an investigation spine, explainable risk, and proof stakeholders can trust.